




EUR/USD analysis, USD/CAD and GOLD outlook - Technical Tuesday
In this week’s report, we will provide technical analysis on the EUR/USD and USD/CAD and discuss the GOLD outlook. The slight risk off tone across financial markets has kept the dollar supported on haven flows. But with US CPI to come, we could see a potential reversal in the dollar’s bullish trend this week, with major currency pairs testing some key levels.
Share this:

- EUR/USD analysis: Could euro bottom soon?
- Gold outlook: Metal still holding long-term levels
- USD/CAD technical analysis: Loonie hits 1.35 resistance
In this week’s report, we will provide technical analysis on the EUR/USD and USD/CAD and discuss the GOLD outlook. The slight risk off tone across financial markets has kept the dollar supported on haven flows. But with US CPI to come, we could see a potential reversal in the dollar’s bullish trend this week, with major currency pairs testing some key levels.
EUR/USD analysis: Could euro bottom soon?
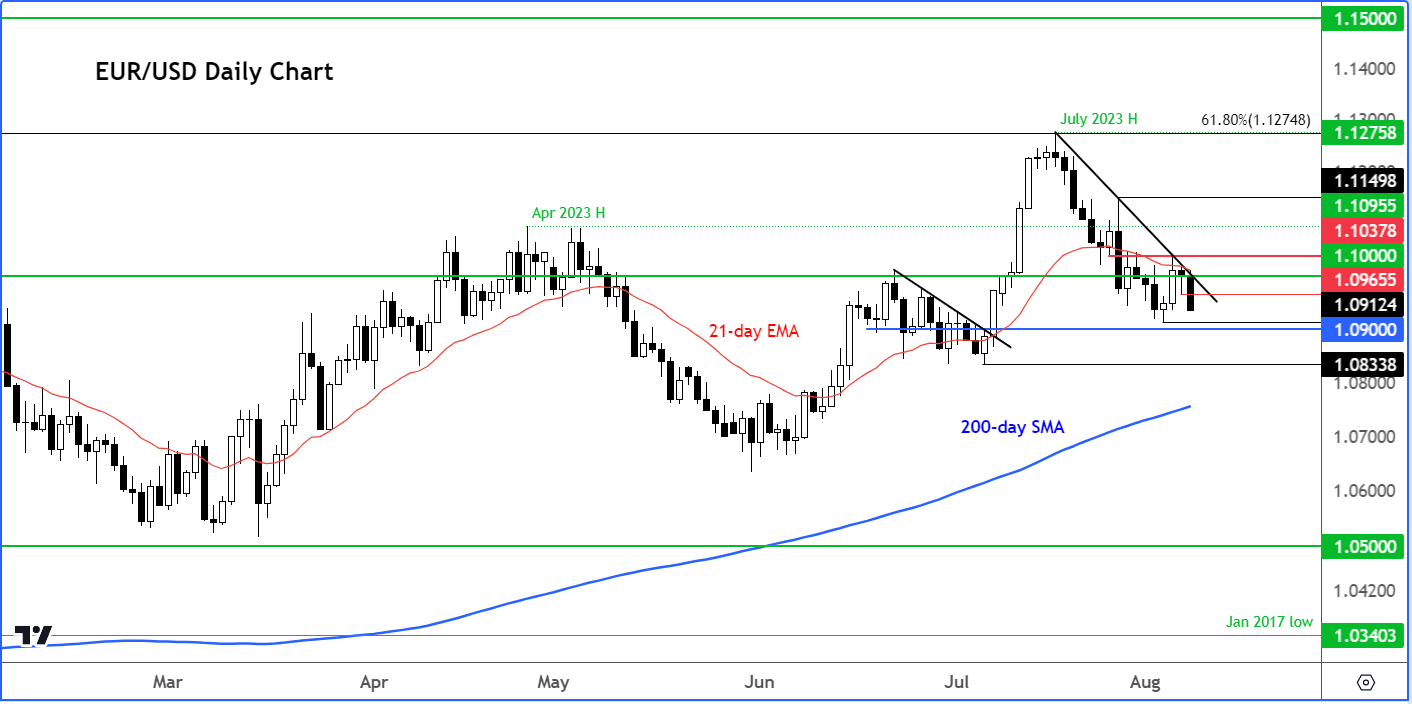
The EUR/USD was unable to reclaim broken support around 1.1030-1.1050 area following Friday’s rally as the slight risk off tone across financial markets have kept the dollar supported on haven flows. Similar price action has been witnessed in other dollar pairs, gold and silver.
So, the move lower in the EUR/USD has entirely been due to the renewed strength in US dollar, than necessarily weakness in the euro. Indeed, some euro crosses like the EUR/AUD and EUR/NZD have broken to new highs on the year, pointing to strength in the single currency. This means that when the dollar eventually tops out, the euro stands ready to benefit, as it is relatively stronger compared to the likes of the AUD and NZD.
So far, we haven’t seen any signs of a bottom for the EUR/USD, as it continues to break short-term support levels. The base of the big breakout in July was around 1.0900 to 1.0920 area, which has already been tested last week, leading to a nice rally. However, the rebound faded and we are now back to square one. The bulls will want to see a clear reversal pattern form around the currency levels if they are to maintain control of the long-term bullish trend.
The line in the sand is at 1.0833, the low from July. Any move below that level would nullify this year’s bullish trend because we will then have a lower low in the EUR/USD.
But clearly, the onus is on the bulls. They will need to show up and fast. Perhaps a potentially weaker US CPI could trigger the recovery on Thursday.
Gold outlook: Metal still holding long-term levels
The renewed strength in bond yields amid all the policy tightening from major central banks have prevented gold from staging a clear breakout, with price action turning bearish ever since the metal hit a new record of $2081 in May. A monthly close above $2K still remains elusive for gold. With the breakdown of support levels such as $2000 and then $1980, the bears have got back some control.
But if you zoom out from the recent short-term price action, you will notice that the long-term technical levels on gold are holding, and the metal may push higher again in the not-too-distant future. The bulls must wait for a bullish signal, though, rather than pre-empt any moves as the recent price action has not been too convincing.
Still, it is important not to get too bearish until there is more evidence that the metal has indeed topped out. With the 200-day average sloping upwards, and gold holding its own above the key $1900 support level, gold investors would not be too bothered about the recent bearish price action.
In the short-term, bullish gold speculators would need to see the formation of a hammer-like candle to signal that the metal has bottomed out. Would that happen at some point this week, with the release of US CPI remains to be seen. But clearly US interest rates are at or near a peak. If gold were to fall big time, it should have done so by now. The fact that this hasn’t happened despite the Fed’s aggressive tightening, is perhaps a sign of strength.
USD/CAD technical analysis: Loonie hits 1.35 resistance
The USD/CAD rallied to 1.35 handle, after rising more than 115 pips on the session, extending its advance from last week. The USD/CAD was testing its bearish trend line around this key psychological level at the time of writing. With the US CPI due on Thursday, there is a possibility that rates may start to decline again from around the current levels. An improvement in risk appetite could certainly help. That being said, until and unless the bears return with a vengeance to cause a clear reversal in the trend, we wouldn’t entertain any trade ideas on the short side. Key support is now at 1.3385 to 1.3400 area, which had been strong resistance in the past. This is that area that the bulls must no defend following the breakout. Failure to do so would most likely trigger a sharp slide. Meanwhile, the next upside target is from here is just under 1.3570, the 61.8% Fibonacci retracement level and the base of the breakdown back in early June.
Source for all charts used in this article: TradingView.com
-- Written by Fawad Razaqzada, Market Analyst
Follow Fawad on Twitter @Trader_F_R
How to trade with City Index
You can trade with City Index by following these four easy steps:
- Open an account, or log in if you’re already a customer
• Open an account in the UK
• Open an account in Australia
• Open an account in Singapore
- Search for the company you want to trade in our award-winning platform
- Choose your position and size, and your stop and limit levels
- Place the trade
Related tags:



Open an account in minutes
Experience award-winning platforms with fast and secure execution, and enjoy tight spreads from 0.5 pts on FX and 0.3 pts on indices.
Economic calendar
Web Trader platform
Our sophisticated web-based platform is packed with features.
Related articles

AUD/USD forecast: Currency Pair of the Week | September 28, 2026
The week has started with stocks, gold, silver and bitcoin all falling, as crude oil rebounded and bond yields pushed further higher. Trump refusing to agree to Tehran’s proposal to re-open the Strait of Hormuz has left the markets disappointed. Still, reports that mediators are expected to hold talks with the two sides on an amended version of the 7-day proposal that Iran presented, keeps hopes alive that we may see some progress.

US Dollar Bulls Return as Euro and Pound Shorts Build | COT Report
US dollar net-longs surged at their fastest pace in seven years as futures traders added bearish exposure to the euro and British pound.


Gold Outlook: XAU/USD hit hard as US yields, dollar resume ascent
A stronger dollar, surging front-end yields and renewed geopolitical tension have combined to push gold back towards key technical support.

This report is intended for general circulation only. It should not be construed as a recommendation, or an offer (or solicitation of an offer) to buy or sell any financial products. The information provided does not take into account your specific investment objectives, financial situation or particular needs. Before you act on any recommendation that may be contained in this report, independent advice ought to be sought from a financial adviser regarding the suitability of the investment product, taking into account your specific investment objectives, financial situation or particular needs.
StoneX Financial Pte. Ltd., may distribute reports produced by its respective foreign entities or affiliates within the StoneX group of companies or third parties pursuant to an arrangement under Regulation 32C of the Financial Advisers Regulations. Where the report is distributed to a person in Singapore who is not an accredited investor, expert investor or an institutional investor (as defined in the Securities Futures Act), StoneX Financial Pte. Ltd. accepts legal responsibility to such persons for the contents of the report only to the extent required by law. Singapore recipients should contact StoneX Financial Pte. Ltd. at 6826 9988 for matters arising from, or in connection with the report.
In the case of all other recipients of this report, to the extent permitted by applicable laws and regulations neither StoneX Financial Pte. Ltd. nor its associated companies will be responsible or liable for any loss or damage incurred arising out of, or in connection with, any use of the information contained in this report and all such liability is hereby expressly disclaimed. No representation or warranty is made, express or implied, that the content of this report is complete or accurate.
StoneX Financial Pte. Ltd. is not under any obligation to update this report.
Trading CFDs carries a high level of risk that may not be suitable for some investors. Consider your investment objectives, level of experience, financial resources, risk appetite and other relevant circumstances carefully. The possibility exists that you could lose some or all of your investments, including your initial deposits. If in doubt, please seek independent expert advice. Visit www.forex.com/en-sg/terms-and-policies for the complete Risk Disclosure Statement.