




GBP/USD Testing Breakout at Fresh 3-Year Highs
GBP/USD has broken out to fresh three-year highs even as USD remains above its own three-year lows.
Share this:

GBP/USD Talking Points:
- USD weakness has persisted through Jerome Powell’s second day of testimony and the US Dollar sits just above recently established three-year lows.
- GBP/USD has already broken out to fresh three-year highs, however, and this comes after the morning’s pullback to support at the 1.3594 level looked at in yesterday’s webinar.
- GBP/USD and USD/CAD remain of attraction for USD-weakness scenarios, as looked at in the below video.
GBP/USD has punched up to a fresh three-year high even as the USD sits above its own three-year low. The kitchen sink has been thrown at the Dollar so far this week as Jerome Powell sounded more dovish over the past two days of testimony than he did at last week’s rate decision. And this comes after the week started with a bang as Michelle Bowman said that she was ready to cut rates as early as July, catching many by surprise after a rally had shown in the Dollar coming into this week.
That dovish lean has helped to push USD back down towards lows and U.S. equities back towards highs, as looked at a little earlier today.
While chasing USD-lower while near fresh lows can be challenging, the fact of the matter is that sellers remain in-control and it’s their trend until there’s evidence otherwise. For that USD-weakness backdrop, I remain of the mind that both GBP/USD and USD/CAD are two of the more attractive backdrops for those themes to continue playing out.
In GBP/USD, the pair has traded cleanly with a pullback into this morning with price finding support right at the 1.3594 level looked at in yesterday’s webinar. That price helped to set the low just after the U.S. open, which was followed by a rally and breakout to fresh three-year highs in the pair.
GBP/USD 30-Minute Chart
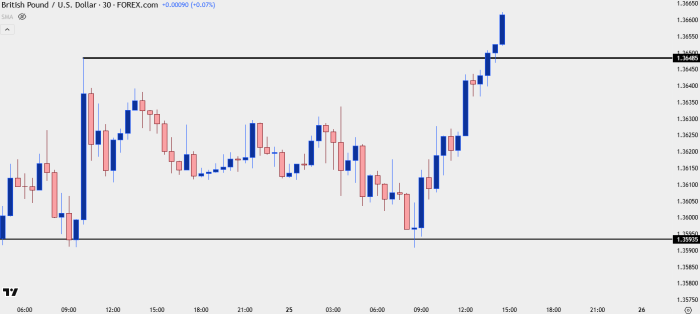
Chart prepared by James Stanley; data derived from Tradingview
GBP/USD Near-Term Strategy
The challenge at this point is that the breakout has already happened, and the fear would be chasing an already-developed move. From the video, I shared a series of levels that can be looked to for short-term pullback potential, with the closes taken from a spot of prior resistance around 1.3639. Below that, another prior resistance swing sits at 1.3629 and then there’s a zone around 1.3611.
You’ll probably notice that all three of these levels are very close to near-term price, and that’s what I would like to see hold to keep the door open for momentum strategies. Below, I’ll take a step back and look at the matter from a longer-term perspective to see how swing traders with longer time horizons might approach the matter.
GBP/USD 30-Minute Chart
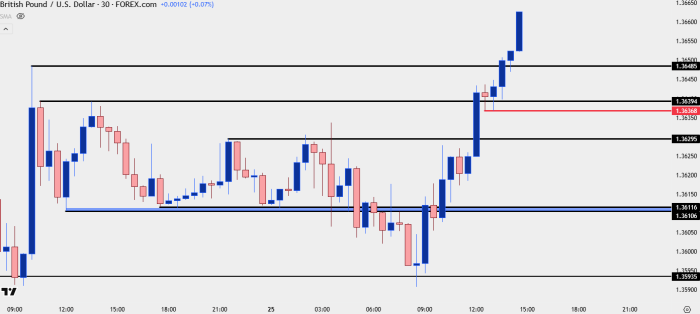
Chart prepared by James Stanley; data derived from Tradingview
GBP/USD Longer-Term
The past three days have been especially bullish in Cable as the 1.3414 support zone led in to a launch of a move that’s now added almost 300 pips to the spot price from the early-week lows.
These are tough moves to chase, but with some scope, we can identify structure that remains key for trend continuation. The 1.3611 zone looked at above is very near a key inflection point taken from the below daily chart around 1.3616. A hold here on a corresponding pullback could be seen as a very bullish item. The key for that would be a hold above the 1.3594 level that set the lows for this morning, showing an element of anticipation from buyers on pullbacks.
If price does sink below that level, then the 1.3500 handle is the next attractive level, in my opinion. The reason for the 94 pip distance would be just how messy the past month has been between 1.3594 and 1.3500, making it difficult to find any clear prices with which we can draw much inference. If 1.3500 is violated, then the look goes back to 1.3414 and a re-test there would need to be met with a higher-low above the Monday swing to keep the door open for bulls.
GBP/USD Daily Price Chart
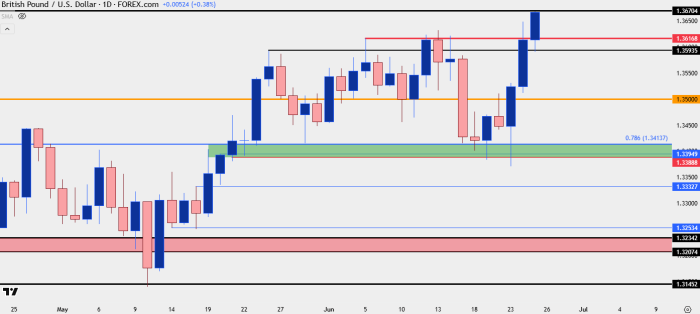
Chart prepared by James Stanley; data derived from Tradingview
--- written by James Stanley, Senior Strategist
Related tags:



Open an account in minutes
Experience award-winning platforms with fast and secure execution, and enjoy tight spreads from 0.5 pts on FX and 0.3 pts on indices.
Economic calendar
Web Trader platform
Our sophisticated web-based platform is packed with features.
Related articles
This report is intended for general circulation only. It should not be construed as a recommendation, or an offer (or solicitation of an offer) to buy or sell any financial products. The information provided does not take into account your specific investment objectives, financial situation or particular needs. Before you act on any recommendation that may be contained in this report, independent advice ought to be sought from a financial adviser regarding the suitability of the investment product, taking into account your specific investment objectives, financial situation or particular needs.
StoneX Financial Pte. Ltd., may distribute reports produced by its respective foreign entities or affiliates within the StoneX group of companies or third parties pursuant to an arrangement under Regulation 32C of the Financial Advisers Regulations. Where the report is distributed to a person in Singapore who is not an accredited investor, expert investor or an institutional investor (as defined in the Securities Futures Act), StoneX Financial Pte. Ltd. accepts legal responsibility to such persons for the contents of the report only to the extent required by law. Singapore recipients should contact StoneX Financial Pte. Ltd. at 6826 9988 for matters arising from, or in connection with the report.
In the case of all other recipients of this report, to the extent permitted by applicable laws and regulations neither StoneX Financial Pte. Ltd. nor its associated companies will be responsible or liable for any loss or damage incurred arising out of, or in connection with, any use of the information contained in this report and all such liability is hereby expressly disclaimed. No representation or warranty is made, express or implied, that the content of this report is complete or accurate.
StoneX Financial Pte. Ltd. is not under any obligation to update this report.
Trading CFDs carries a high level of risk that may not be suitable for some investors. Consider your investment objectives, level of experience, financial resources, risk appetite and other relevant circumstances carefully. The possibility exists that you could lose some or all of your investments, including your initial deposits. If in doubt, please seek independent expert advice. Visit www.forex.com/en-sg/terms-and-policies for the complete Risk Disclosure Statement.