
U.S. Dollar, USD Talking Points:
- The U.S. Dollar has reversed gains from the move around last week’s FOMC meeting and at this point the currency sits just above the fresh three-year lows that were established earlier in June.
- FOMC members have sounded more dovish than what the forecasts last week suggested, and Fed-speak so far this week combined with diminished tensions in the Middle East have allowed the USD to push back towards lows.
- This is an archived webinar and you’re welcome to attend the next installment. Click here to register.
The U.S. Dollar has made a push for the lows and this erases an earlier week breakout that had continued a rally from last week’s lows. While inflation potential remained a hot button into this week’s open, both from tariffs as spoken to by Jerome Powell last week and more recently geopolitical tensions around Iran, dovish Fed-speak and a lowering of tensions have allowed the greenback to sink towards a key spot of support that’s been in-play fro the past couple of weeks.
At this point, the weekly chart of DXY is showing a trendline test with the fresh three-year lows established two weeks ago very nearby.
U.S. Dollar Weekly Chart
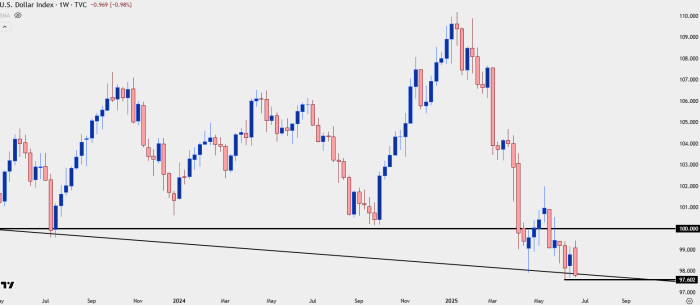
Chart prepared by James Stanley; data derived from Tradingview
USD Shorter-Term
At this point USD bears have an open door to push for fresh lows. That’s similar to early last week, but at that point sellers dried up and left a higher-low, which then led to the pullback move that ran into this week’s open.
This provides a bit of structure, with higher-lows at 97.62 and 97.69. In the webinar I went over a few scenarios along with related pairings. Fresh bearish exposure could prove challenging at this point given how aggressively the move has priced in over the past couple of days. This sets up possible resistance potential at 98.49 and 98.87, and for breakdown attempts, current support could be re-assigned as resistance for bearish continuation scenarios.
U.S. Dollar Four-Hour Chart
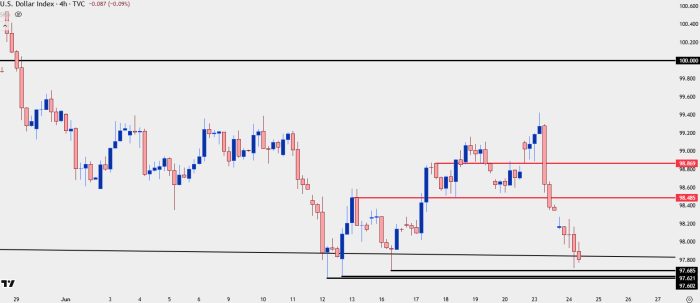
Chart prepared by James Stanley; data derived from Tradingview
USD/JPY
USD/JPY has held up a bit better than many other major pairs as there remains higher-lows from the 140.00 inflection in April and the 142.50 support in May.
For bigger picture USD bearish scenarios, a break of that 140.00 handle could have wide-ranging consequences but, for now, there’s a bullish trendline in-place and price is testing a key level around the 145.00 handle. For deeper support, there’s a trendline projection originating from the April lows that currently projects to around 143.50-143.75.
USD/JPY Daily Chart
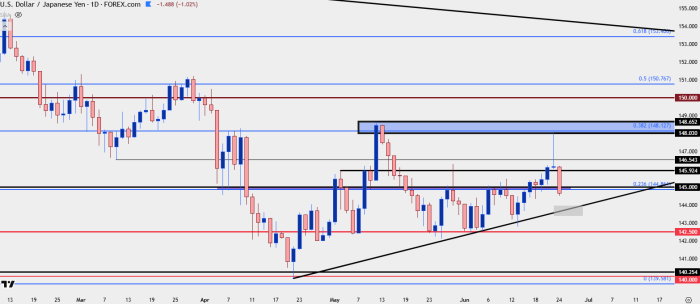
Chart prepared by James Stanley; data derived from Tradingview
EUR/USD
EUR/USD pushed up to a fresh three-year high this morning but notably, prices couldn’t continue very far beyond that level. I talked about this quite a bit in the webinar as that deduction didn’t necessarily mean that a reversal was imminent, but it did highlight some levels of importance that can be tracked for strategy around the pair.

EUR/USD Four-Hour Chart
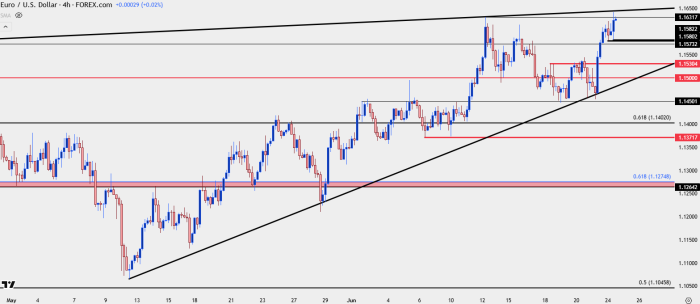
Chart prepared by James Stanley; data derived from Tradingview
EUR/USD Wedge
If we do see USD buyers defend higher-low support, EUR/USD remains as a venue that I think could be more attractive for swings. There’s a remaining rising wedge in play with the upper trendline so far holding the highs today.
EUR/USD Daily Chart
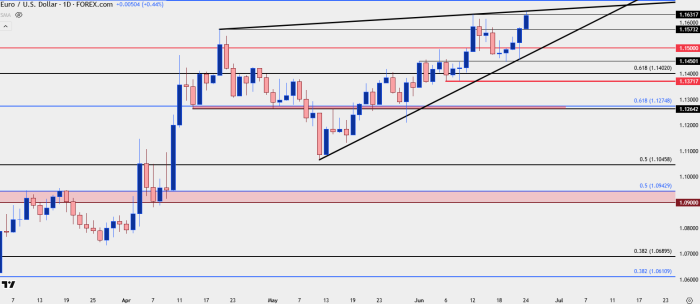
Chart prepared by James Stanley; data derived from Tradingview
GBP/USD
For USD-weakness scenarios, I still favor GBP/USD over EUR/USD, along with USD/CAD, as well.
In GBP/USD, the pair pulled back and held support at a really important spot last week and into this week, taken from the 1.3414 Fibonacci level. This is what held the highs last year and then in April, but it’s now become support.
GBP/USD Weekly Chart
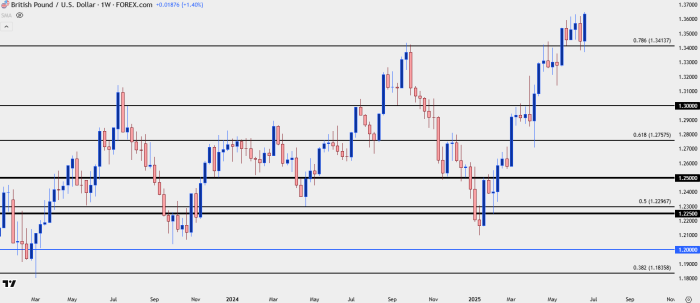
Chart prepared by James Stanley; data derived from Tradingview
GBP/USD Shorter-Term
The trend so far this week from support has been impressive in Cable. It also highlights a market that’s difficult to chase, but there is some structure to look to for higher-low support potential. A prior swing high at 1.3594 and the 1.3500 psychological levels stand out as reference points, with the 1.3389-1.3414 zone sitting below.
GBP/USD Four-Hour Chart
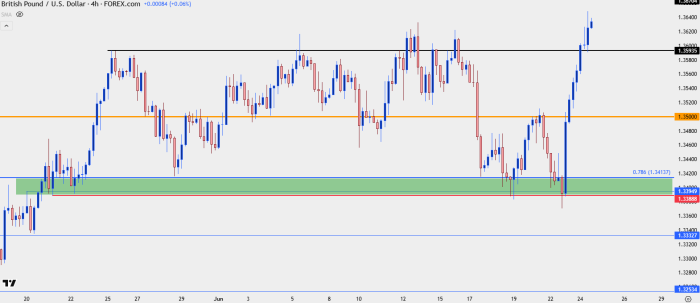
Chart prepared by James Stanley; data derived from Tradingview
USD/CAD
I wrote about this one yesterday as price had sunk back below the 1.3750 level, which remains an important spot. I still think USD/CAD remains an attractive venue for USD-weakness scenarios, but as looked at in the webinar, the pair is currently set up for counter-trend backdrops, as there’s been a hold of support at the 1.3679-1.3694 zone looked at in yesterday’s article.
Notably, sellers did drive down to the bottom of that zone, so this could end up as a shorter-term lower-low, but bearish strategies right now seem a bit more challenging. This does setup for a possible short-term bounce up to the 1.3743-1.3751 zone, which could suffice as a lower-high.

USD/CAD Four-Hour Chart
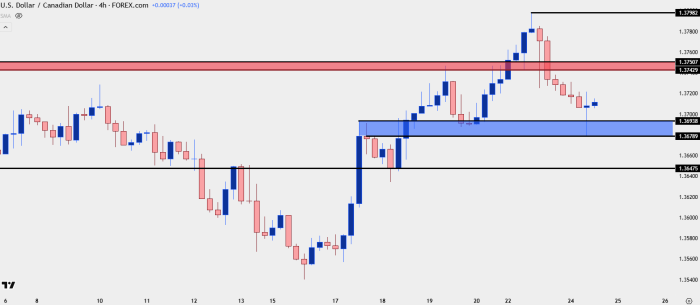
Chart prepared by James Stanley; data derived from Tradingview
The daily chart highlights why a hold of a lower-high here would be key for bearish continuation, a push above 1.3798 would constitute a higher-high to go along with a higher-low on the daily chart. This would then open up for deeper pullbacks, towards the 1.3889-1.3905 zone or perhaps even the 1.3980-1.4000 area that was last in-play in May.
USD/CAD Daily Chart
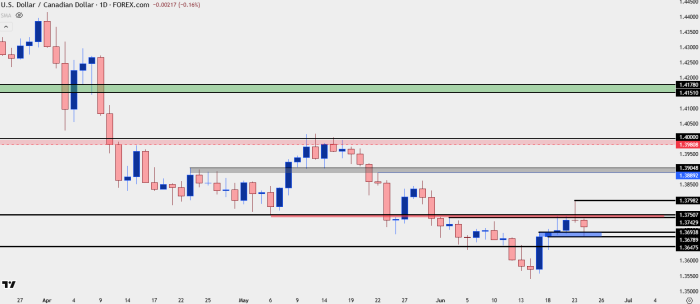
Chart prepared by James Stanley; data derived from Tradingview
--- written by James Stanley, Senior Strategist