
USD/JPY, U.S. Dollar talking points:
- USD/JPY continues to mirror broader macro themes around the U.S. Dollar.
- Last week’s bullish move in USD around the FOMC meeting helped to push USD/JPY above 145.00, but it was the prospect of geopolitical risk that helped to push a test of 148.00 after this week’s open.
- That test has since failed as a comment from Michelle Bowman pushed up probabilities for a July cut.
- I’ll be looking into USD/JPY in-depth during the Price Action Webinar, and you’re welcome to join. Click here to register.
USD/JPY continues to be a tough spot for breakouts as this week saw a test of the same 148.00 level that was in-play last month. And like we saw in May, that was around where buying pressure dried up, followed by a swift reversal.
There is some differing context, however, but no matter how you cut it, the daily bar is shaping up to be an ugly outing for bulls. As of this writing there’s a little more than two hours left in the session so this can change, but at this point price is showing as almost a gravestone doji on the daily, and if sellers are able to continue pushing into the close we may end up with a pin bar formation, which is often approached with aim of reversals.
USD/JPY Daily Chart
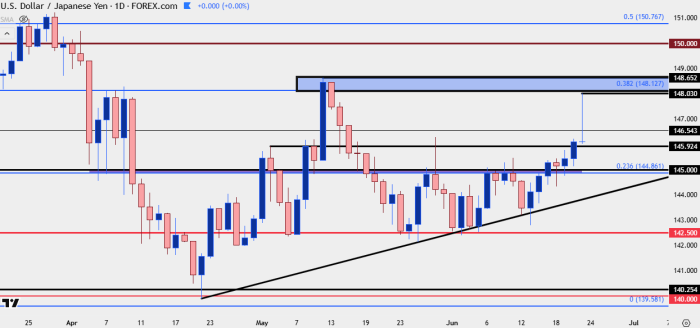
Chart prepared by James Stanley; data derived from Tradingview
USD/JPY: The Drive
I’ve been talking about this for a while now, but it seems that there remains built-in positioning on the long side of the pair as pushed by the carry trade that started a few years ago. We saw some of that unwind last summer, but USD/JPY held the psychological 140.00 level and fear quickly abated as the pair reversed. Another test there in April led to a bounce in USD/JPY along with the U.S. Dollar.
This makes sense from a fundamental perspective as higher odds of rate cuts compress rate differentials between the two economies, thereby motivating close of hedges around that carry trade. But lower probabilities of rate cuts, such as we saw after FOMC last week, could soothe those nerves, and lead to a move-higher in both USD and USD/JPY.
The big push point on that front remains inflationary potential around tariffs, which it seems the Fed does not want to dismiss. But as we came into this week, there was also the geopolitical risk to account for. If we do see increased tensions in the Middle East, which could come with higher oil prices, there could be another effect of higher inflation potential, which would be met with lower rate cut probability.
This is likely what drove the breakout in USD to start the week, along with the breakout and test of 148.00 in USD/JPY. But, as tensions have eased after Iran retaliated, which I explained in the above video illustrated by the sell-off in Oil, so too has the rally in both USD and USD/JPY.
In the USD/JPY pair, the big question now is whether sellers can break shorter-term bullish structure. We’re fast approaching a key level at 145.92, and below that is a really important zone from 144.86 up to 145.00. This was resistance last week into FOMC that was turned into support around and just after the meeting.

USD/JPY Four-Hour Chart
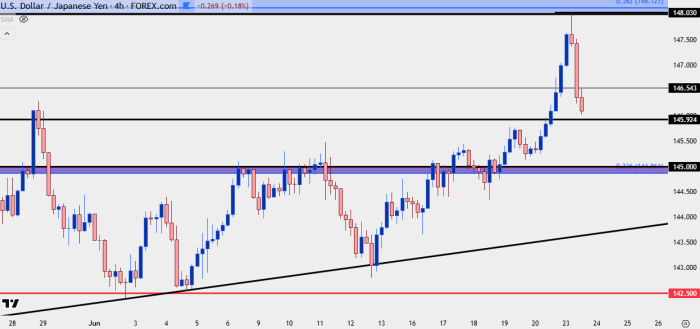
Chart prepared by James Stanley; data derived from Tradingview
--- written by James Stanley, Senior Strategist