


Gold Analysis: Asian Open – 24th July 2023
Gold's rally at the start of the week fizzled out over the last three days as the US dollar recovered. Whilst we see the potential for a leg higher over the near-term, a move back towards 1946 - 1950 seems feasible.
Share this:

Market Summary:
- The Japanese yen was sharply lower across the board on Friday in the early stages of the European session on a Reuters report that the BOJ are likely to hold monetary policy unchanged this week
- Earlier during Friday’s Asian session, the yen was already facing selling pressure due to softer-than-expected inflation data
- USD/JPY rose to just shy of 142 on its best day in nearly three months
- Soft retail sales data in Canada points to a slowing economy and takes some pressure off of the OC to hike again in September, sending USD/CAD to a 3-day high. Sales rose just 0.2% m/m compared with 1.1% previously, and 0% y/y compared with 1.3% previously.
- Yet UK shoppers continue to defy rising interest rates, with retail sales rising 0.7% m/m (up from 0.3%) which keeps the pressure on the BOE to hike (even if 50bp is debatable given inflation may have peaked). GBP/CAD broke a 4-day losing streak and shows the potential to head for 1.7100 over the near-term.
Events in focus (AEDT):
Flash PMI data is very much the theme of the day with data coming out for Australia, Germany, Eurozone, UK and the US. And this places AUD/USD, EUR/USD, GBP/USD and the radar for FX majors traders.
-
- 09:00 – Australian manufacturing and services PMI
- 17:30 – German manufacturing, services and composite PMI
- 18:00 – Eurozone manufacturing, services and composite PMI
- 18:30 – UK manufacturing, services and composite PMI
- 23:45 – US manufacturing, services and composite PMI

Technically Speaking:
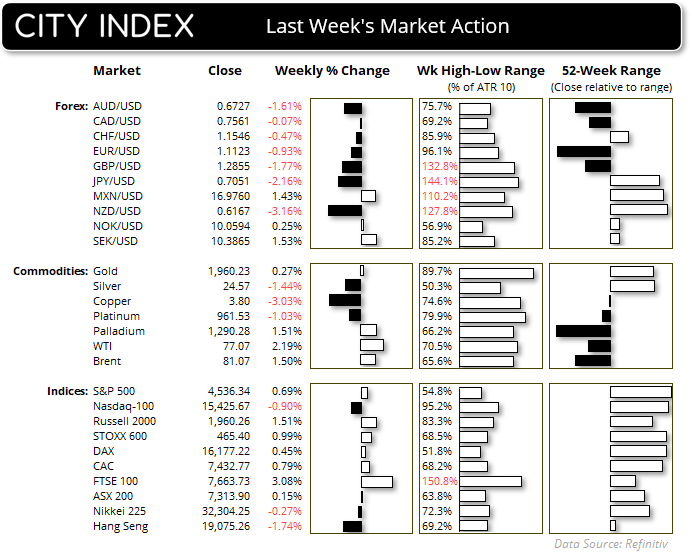
- USD/JPY erased most of the prior week’s losses and is consolidating around the weekly highs. The move may be overextended over the near term, so bulls may want to see dips above 140.50 for a potential move to 143
- AUD/USD fell to a 7-day low, but it may be able to find support above 67c over the near term, around the original breakout level on July 1th
- NZD/USD retraced for a sixth day and saw a bearish Marabuzo week formed, which is a bearish engulfing candle with little to now upper or lower wick. Bears may want to fade into minor rallies on the intraday timeframe and seek a move down to 61c
- AUD/JPY formed another bullish hammer week, although this time with a bullish close and Friday’s rally stopped just short of the head and shoulders target around 95.93. The pair remains one to consider for bulls to enter on dip leading into Friday’s BOJ meeting, assuming appetite for risk remains supported
- AUD/NZD reached our 1.0900 target, and it wouldn’t come as a huge surprise to see prices consolidate or retrace from current levels. At which point we’d seek evidence of a higher low above 1.0800.
- The Nikkei 225 retraced lower for a second day on Friday and formed a spinning top Doji. A break above Friday’s high assumes bullish continuation whilst prices hold above Friday’s low.
- The China A50 printed a bullish engulfing candle on Friday to suggest a swing ow in place. As mentioned in last Monday’s report, we’re looking for a potential break above the bearish trendline from the YTD high whilst prices hold above the 12,400 lows.
- Gold rose for a third week yet printed a bearish hammer around 1985, suggesting at least a pause in its rally ahead of Wednesday’s FOMC meeting
- WTI crude oil rose for a third week
- The US dollar index (DXY) retraced against losses sustained the prior week, and came close to touching the May 2022 low in line with our near-term bullish bias. Support was also found at the 200-day EMA with a double bottom, which leaves room for further upside if the Fed are more hawkish as expected later this week (or a decent swing trade short opportunity of they provide a dovish hike).
ASX 200 at a glance:
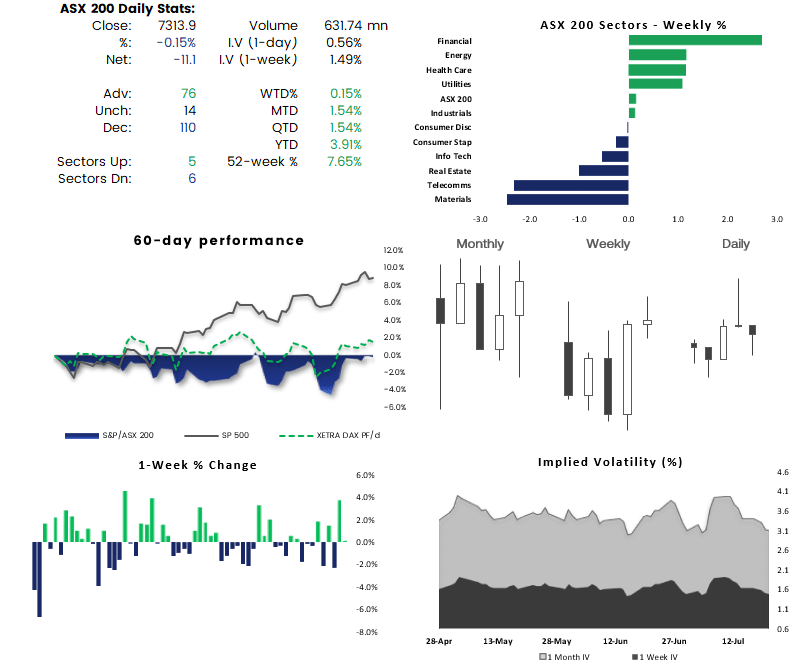
- The ASX 200 produced a spinning top doji last week beneath 7400 resistance to show the prior week’s rally has lost steam
- Volatility was around half of the prior week’s range
- It closed slightly higher which means it was the first week to not alternate its direction in six weeks
- Prices also closed back above 7300
- I retain the view that volatility may be lower and traders may want to seek opportunities on intraday timeframes, or opt to step aside until its next directional move gets underway

Gold 4-hour Chart:
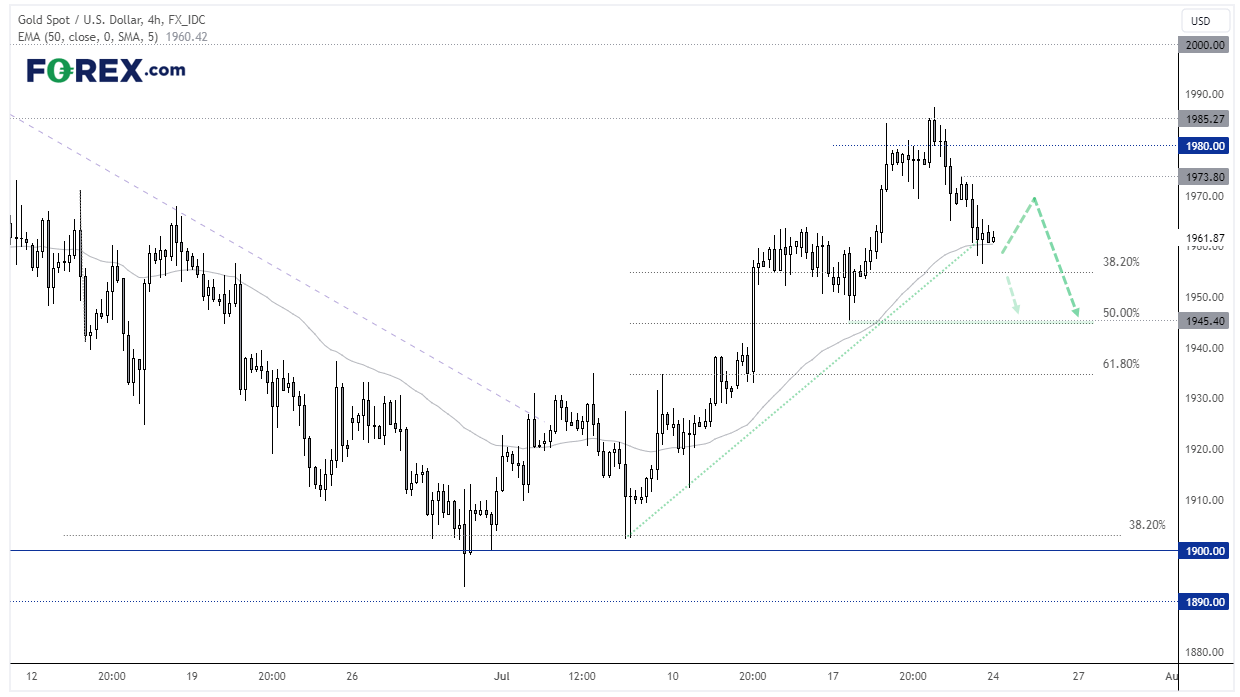
Gold retraced lower for a third day on Friday after reaching out initial $1985 target. It likely requires a dovish tone to the Fed’s meeting on Wednesday for it to stand any chance of heading to $2000, and volatility may be lower heading into the event.
The 4-hour chart shows prices respecting a bullish trendline, although I question its strength given the Oji which already pierced it on Friday. Still, prices are holding above the 38.2% Fibonacci ratio, so perhaps we can see a minor bounce towards 1973 over the near-term. A break beneath 1955 brings the lows around $1946 into focus.

-- Written by Matt Simpson
Follow Matt on Twitter @cLeverEdge
How to trade with City Index
You can trade with City Index by following these four easy steps:
- Open an account, or log in if you’re already a customer
• Open an account in the UK
• Open an account in Australia
• Open an account in Singapore
- Search for the market you want to trade in our award-winning platform
- Choose your position and size, and your stop and limit levels
- Place the trade
Related tags:
Latest market news




Open an account in minutes
Experience award-winning platforms with fast and secure execution, and enjoy tight spreads from 0.5 pts on FX and 0.3 pts on indices.
Economic calendar
Web Trader platform
Our sophisticated web-based platform is packed with features.
Related articles
Australian Dollar Outlook: AUD/USD Holds 70c Ahead of RBA and CPI
AUD/USD faces an expected RBA hike and Australian CPI before attention turns to US PCE, ISM and nonfarm payrolls later in the week.
EUR/USD weekly outlook: Oil, inflation and NFP in focus
After coming under significant pressure in recent weeks, the EUR/USD came off its lows to finish the week on a positive note on Friday, albeit with only a mild rebound. That was not enough to prevent the exchange rate falling for the third consecutive week, as the US dollar and bond yields rallied across the board.

Gold Q4 2026 outlook: Resilience in the face of rallying dollar and yields
As we headed towards the latter stages of Q3 and into Q4, the Fed had just hiked rates in a hawkish FOMC meeting, while the likes of the ECB and BoJ had also tightened their respective policies. Oil prices remained elevated amid the prolonged US-Iran conflict. Meanwhile, bond yields were breaking out, and the dollar was higher across the board. Yet, remarkably, gold was still holding in the positive territory for the third quarter, even if it had weakened somewhat in September.
This report is intended for general circulation only. It should not be construed as a recommendation, or an offer (or solicitation of an offer) to buy or sell any financial products. The information provided does not take into account your specific investment objectives, financial situation or particular needs. Before you act on any recommendation that may be contained in this report, independent advice ought to be sought from a financial adviser regarding the suitability of the investment product, taking into account your specific investment objectives, financial situation or particular needs.
StoneX Financial Pte. Ltd., may distribute reports produced by its respective foreign entities or affiliates within the StoneX group of companies or third parties pursuant to an arrangement under Regulation 32C of the Financial Advisers Regulations. Where the report is distributed to a person in Singapore who is not an accredited investor, expert investor or an institutional investor (as defined in the Securities Futures Act), StoneX Financial Pte. Ltd. accepts legal responsibility to such persons for the contents of the report only to the extent required by law. Singapore recipients should contact StoneX Financial Pte. Ltd. at 6826 9988 for matters arising from, or in connection with the report.
In the case of all other recipients of this report, to the extent permitted by applicable laws and regulations neither StoneX Financial Pte. Ltd. nor its associated companies will be responsible or liable for any loss or damage incurred arising out of, or in connection with, any use of the information contained in this report and all such liability is hereby expressly disclaimed. No representation or warranty is made, express or implied, that the content of this report is complete or accurate.
StoneX Financial Pte. Ltd. is not under any obligation to update this report.
Trading CFDs carries a high level of risk that may not be suitable for some investors. Consider your investment objectives, level of experience, financial resources, risk appetite and other relevant circumstances carefully. The possibility exists that you could lose some or all of your investments, including your initial deposits. If in doubt, please seek independent expert advice. Visit www.forex.com/en-sg/terms-and-policies for the complete Risk Disclosure Statement.