







Gold and Silver forecast: Metals extend gains ahead of key US data
Today’s data dump includes the ADP private payrolls, unemployment claims, factory orders and ISM services PMI. Friday will see the release of the June payrolls data. Judging by a weaker US dollar (outside of the USD/JPY pair), it looks like investors are expecting this week’s data to be overall on the weaker side. In any case, our bullish gold and silver forecast remain unchanged.
Share this:

Precious metals have benefited from rising oil prices fanning inflation worries and French elections uncertainty providing added haven demand for gold and silver. A weakening US dollar this week has further aided the gold and silver recovery. Investors are looking forward to the release of some important US data ahead of US Independence Day break on Thursday. Today’s data dump includes the ADP private payrolls, unemployment claims, factory orders and ISM services PMI. Friday will see the release of the June payrolls data. Judging by a weaker US dollar (outside of the USD/JPY pair), it looks like investors are expecting this week’s data to be overall on the weaker side. In any case, our bullish gold and silver forecast remain unchanged.
Gold forecast: XAU/USD could shine brightly again after recent consolidation
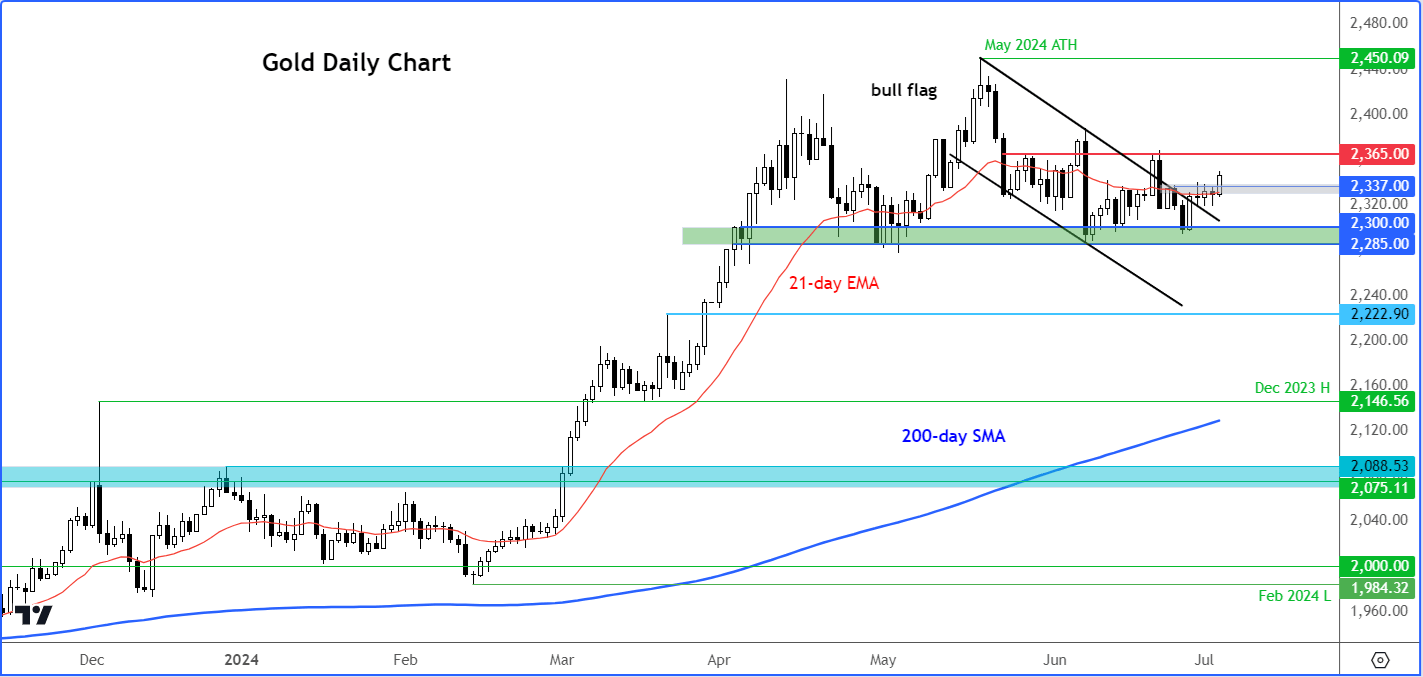
Gold and silver have moved in the positive territory on the week, keeping the long-term charts looking bullish. Throughout June, gold traded within a narrow $100-range, peaking just above $2387 and bottoming just below $2287. This was the first month since February without any new record highs, following a series of all-time highs in the period between March and May. The consolidation paused the rally, but no significant reversal patterns emerged to concern bullish investors. After a quieter June, the bullish trend might resume this month. The charts certainty point that way for both gold and more so silver.
The higher highs and higher lows remain intact despite recent concerns about waning momentum on gold. The metal hit a new all-time high in May before going into a multi-week consolidation phase. The consolidation has eased the 'overbought' conditions in the Relative Strength Index (RSI) on the weekly and monthly charts, primarily through time rather than price action, indicating a bullish sign.
While on the lower time frames you might be able to spot a potential head and shoulders reversal formation, on the weekly gold chart this is not very visible and instead one could argue it is starting to break out of a symmetrical continuation pattern. In any case, gold hasn't broken key support and what would be the neckline of that potential H&S pattern around the $2300 area yet.
So, I reckon gold another bullish breakout may be on the cards. The bears will need to exert significant pressure to reverse the long-term bullish trend, which, until now, they have failed to do.
Gold has broken $2340ish resistance level, which may now turn into support on a potential retest from above. Its next potential resistance level comes in at $2365. A move above this level would further fuel the bulls' confidence that it has resumed its trend and that a new all-time high could be achieved soon.
BUT, if the breakout fails, and gold goes on to break the $2300 support instead, then only in that case will I drop my short-term bullish view on gold. In that potential scenario, we may see some my base case scenario.
Gold-silver ratio breaks down: What does this tell us about precious metals?
The gold-silver ratio reached a significant resistance area between 80.30 and 80.55 and has reacted accordingly there, falling after the re-testing this area from underneath. This follows a major breakdown below a multi-year bullish trend line in early May. The ratio has held resistance, suggesting that silver might outperform gold again. Alternatively, it could indicate that both metals are in a correction phase, with gold declining more rapidly than silver. However, given the bullish trends observed this year, I lean towards a bullish outlook for precious metals. In other words, the breakdown in the ratio underlines my bullish silver forecast more than gold.
Silver forecast: XAG/USD technical analysis
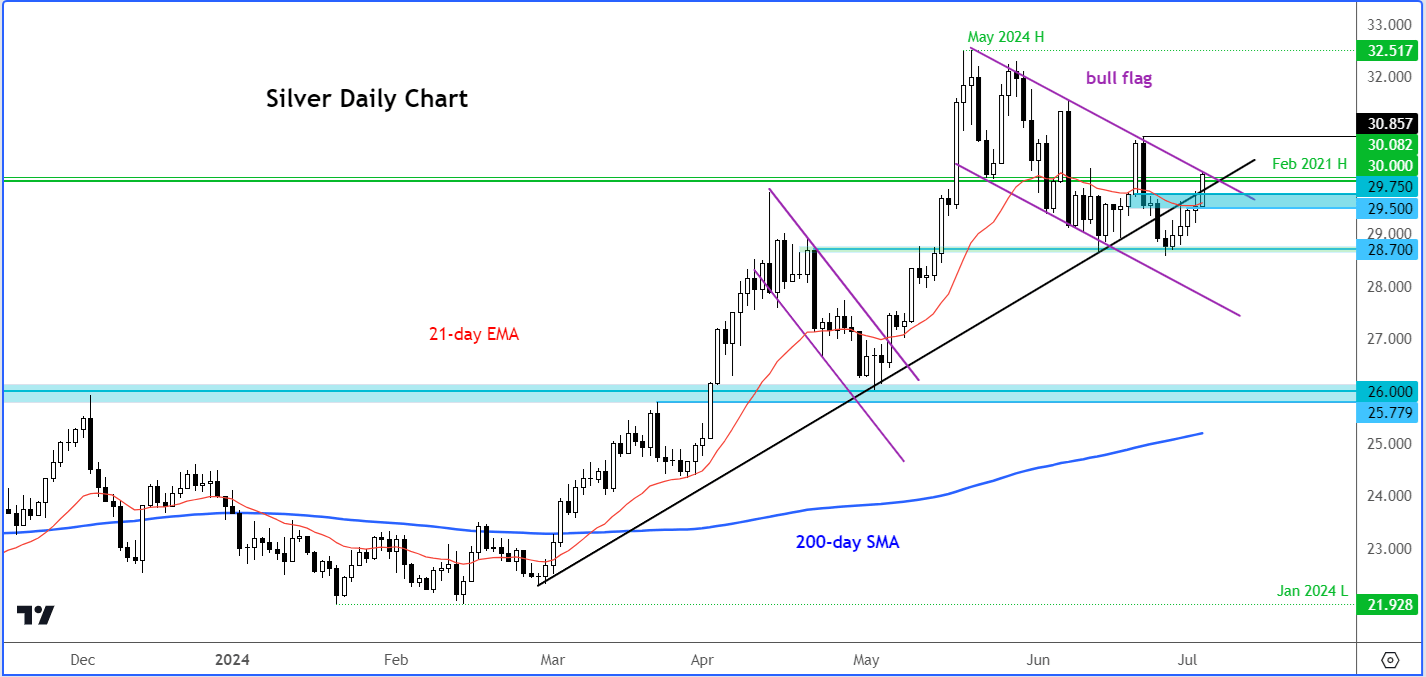
At the time of writing, silver was up 2% on the session, testing the resistance trend of its bull flag pattern around $30.15 to $30.20 area.
Until this week’s recovery, silver had been trending lower in recent weeks, testing a major support area around $28.70 to $29.00. It looks like support held here and it has consequently reclaimed the broken bullish trend line. In the process, it has broken back above resistance in the $29.50 to $29.75 range, an area which now needs to hold as support should we see a dip from around the resistance trend of the bull flag pattern.
What the bulls will want to see next is a clean break out of the bull flag pattern to indicate silver has resumed its long-term bullish trend. While today’s price action is bullish, by no means is silver completely out of the woods just yet. However, the positive technical signs we have observed means that the bullish silver forecast is intact.
Source for all charts in this article: TradingView.com
Gold and silver forecast: Technical analysis video
-- Content created by Fawad Razaqzada, Market Analyst
Follow Fawad on Twitter @Trader_F_R
How to trade with City Index
You can trade with City Index by following these four easy steps:
- Open an account, or log in if you’re already a customer
• Open an account in the UK
• Open an account in Australia
• Open an account in Singapore
- Search for the company you want to trade in our award-winning platform
- Choose your position and size, and your stop and limit levels
- Place the trade
Related tags:



Open an account in minutes
Experience award-winning platforms with fast and secure execution, and enjoy tight spreads from 0.5 pts on FX and 0.3 pts on indices.
Economic calendar
Web Trader platform
Our sophisticated web-based platform is packed with features.
Related articles

Nikkei breakout accelerates as yen weakness returns
Nikkei has started October with a powerful breakout, helped by renewed yen weakness and strong upside momentum


Gold Price Outlook: XAU/USD Resistance at $4200 Sets Up for NFP
It was a strong sell-off to start the week in gold and despite a Tuesday bounce, sellers are continuing to push following a resistance hit at the $4200 level.


The RBA Hiked Rates and the Australian Dollar Still Fell
AUD/USD fell after the RBA rate hike because the central bank's hawkish stance was already priced in while the U.S. dollar stayed firm.
This report is intended for general circulation only. It should not be construed as a recommendation, or an offer (or solicitation of an offer) to buy or sell any financial products. The information provided does not take into account your specific investment objectives, financial situation or particular needs. Before you act on any recommendation that may be contained in this report, independent advice ought to be sought from a financial adviser regarding the suitability of the investment product, taking into account your specific investment objectives, financial situation or particular needs.
StoneX Financial Pte. Ltd., may distribute reports produced by its respective foreign entities or affiliates within the StoneX group of companies or third parties pursuant to an arrangement under Regulation 32C of the Financial Advisers Regulations. Where the report is distributed to a person in Singapore who is not an accredited investor, expert investor or an institutional investor (as defined in the Securities Futures Act), StoneX Financial Pte. Ltd. accepts legal responsibility to such persons for the contents of the report only to the extent required by law. Singapore recipients should contact StoneX Financial Pte. Ltd. at 6826 9988 for matters arising from, or in connection with the report.
In the case of all other recipients of this report, to the extent permitted by applicable laws and regulations neither StoneX Financial Pte. Ltd. nor its associated companies will be responsible or liable for any loss or damage incurred arising out of, or in connection with, any use of the information contained in this report and all such liability is hereby expressly disclaimed. No representation or warranty is made, express or implied, that the content of this report is complete or accurate.
StoneX Financial Pte. Ltd. is not under any obligation to update this report.
Trading CFDs carries a high level of risk that may not be suitable for some investors. Consider your investment objectives, level of experience, financial resources, risk appetite and other relevant circumstances carefully. The possibility exists that you could lose some or all of your investments, including your initial deposits. If in doubt, please seek independent expert advice. Visit www.forex.com/en-sg/terms-and-policies for the complete Risk Disclosure Statement.