



Gold and Silver Price Forecast: Is This Pullback a Dip-Buying Opportunity?
Gold, Silver Price Outlook: The latest drawdowns across gold and silver are reigniting interest in long-term dip-buying opportunities. But is now the right time to buy the dip?
Share this:

The latest drawdowns across gold and silver are reigniting interest in long-term dip-buying opportunities. But is now the right time to buy the dip?
Daily momentum on both gold and silver remains below the neutral 50 level on the RSI, maintaining a bearish bias on the charts as gold trades below 4,600 and silver below 80.
US 2Y + 5Y + 10Y + 30Y Bond Yields – Daily Time Frame (Log Scale)

Source: TradingView
This line chart represents the combined value of US 2-year, 5-year, 10-year, and 30-year Treasury yields. It reflects a notable pullback from yearly highs as recent Middle East escalations are increasingly being interpreted as potential signals of a near-term peace agreement.
The shift in yields is being reflected in precious metals, with gold holding above 4,360 and silver holding above 71.40—both critical support levels dating back to lows last seen in March 2026.
However, momentum on the bond yield chart remains above the neutral 50 mark, leaving room for either a bullish rebound in yields, which could add pressure to precious metals, or a continued decline in yields, providing relief to metals and broader financial markets.
While Treasury yields remain a key driver for precious metals, traders should also monitor the US Dollar Index (DXY). Historically, periods of rising real yields and dollar strength have created headwinds for gold and silver, while declining yields and a softer dollar have supported precious metals.
Recent weakness in aggregate Treasury yields has provided some relief to metals. However, a rebound in yields alongside renewed dollar strength could challenge the latest recovery attempts in both gold and silver. Conversely, further easing in yields and a weaker dollar may reinforce bullish momentum and support another leg higher across the precious metals complex.
Upcoming Events That Could Drive Volatility in Bond Yields and Precious Metals
- US Nonfarm Payrolls (NFP) – Friday
- US CPI Inflation Report – June 10
- FOMC Outlook and Rate Decision – June 17
Further weakness in the labor market, persistent inflationary pressures, and a cautious Federal Reserve stance could weigh on precious metals by supporting yields and the US dollar. At the same time, improving risk sentiment driven by expectations of a potential Middle East agreement may continue to challenge the traditional safe-haven appeal of gold and silver.
Key levels and scenarios for both metals are outlined below.
Gold Price Outlook: Daily Time Frame (Log Scale)

Source: TradingView
From a daily perspective, momentum remains below the neutral mark. However, price action continues to hold above the trendline connecting the series of lower highs formed since March 2026, defining two key scenarios.
Bullish Scenario
A sustained recovery above 4,600 would signal that buyers have successfully defended the March support structure and regained control following the recent correction.
Such a move would confirm a bullish breakout toward 4,660, 4,760, and 4,860, representing more than 200 points of upside potential. These levels align with the boundaries of the previous diamond formation that preceded the recent selloff, making them natural areas for profit-taking and trend validation.
Should the uptrend extend beyond the 4,880 high, the psychologically important 5,000 level would return to focus. A successful break above this area could pave the way toward 5,150, 5,300, and eventually the longer-term 6,000 target.
These projections are derived using the Fibonacci extension tool applied to the cycle between the March 2026 low, April high, and May low.
Bearish Scenario
A sustained break below 4,300 would indicate that the March support base has failed, increasing the probability of a deeper correction toward 4,200 and 4,000. These levels may act as demand zones where long-term investors reassess positioning.
Failure to stabilize could expose 3,800, a level that would represent a meaningful retracement within the broader secular uptrend rather than a complete trend reversal. Such a move could create another attractive long-term dip-buying opportunity for investors seeking strategic exposure to gold.
Silver Price Outlook: Daily Time Frame (Log Scale)
Source: TradingView
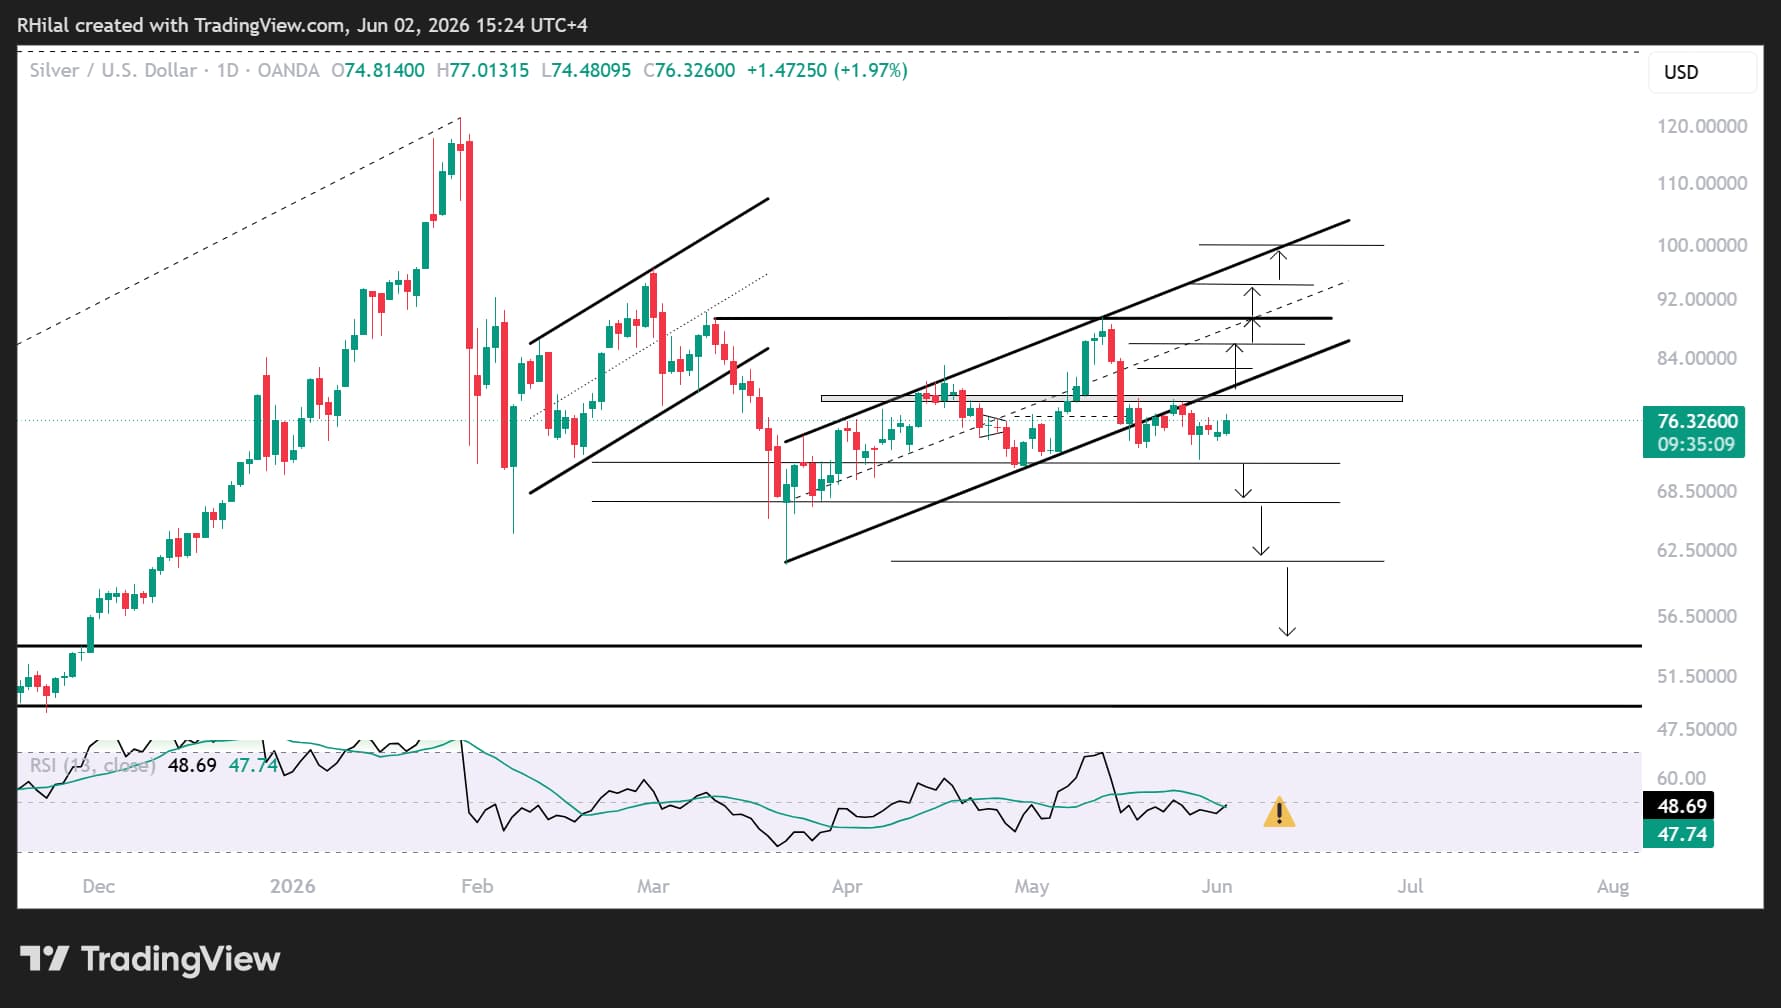
Silver continues to display a bearish bias in both price action and momentum. The RSI is testing the 50 level from below, while price action is facing the lower boundary of a multi-month parallel channel following the latest bearish breakdown.
Compared with gold, silver remains more sensitive to shifts in risk sentiment and industrial demand expectations. This higher volatility profile often results in sharper drawdowns and stronger rebounds, making the current support zone particularly important for trend confirmation.
Bullish Scenario
A sustained move back into the channel above the 79–80 zone would restore the bullish outlook and redirect price action toward 83, 86, and 90.
These levels represent the channel midpoint and previous highs, where another pullback could emerge. Should bullish momentum persist beyond 90, silver could advance toward the upper boundary of the channel near 100 before attempting another breakout to fresh all-time highs.
Bearish Scenario
A breakdown below 71.40 could expose another leg lower toward yearly lows near 67 and 61.
A sustained move below 61 would open the door to 53 and 45, a region that aligns with a major multi-decade resistance zone dating back to the highs of the 1980s. Such a decline could create a high-probability setup for long-term bullish positioning in silver.
Is Now the Time to Buy the Dip?
The recent correction in gold and silver is occurring within the context of a broader long-term uptrend, making current levels increasingly relevant for investors evaluating strategic exposure to precious metals.
However, whether this proves to be a successful dip-buying opportunity or the beginning of a deeper correction will likely depend on the trajectory of Treasury yields, the US dollar, and upcoming macroeconomic data, including inflation, employment, and Federal Reserve guidance.
For long-term investors accumulating physical metals, the current pullback may present attractive opportunities. For traders, however, patience and confirmation remain critical, particularly as seasonal liquidity conditions and geopolitical developments continue to drive elevated volatility across global markets.
As a result, the support and resistance levels outlined above may serve as key decision points in determining whether the next major move in gold and silver is a renewed advance toward record highs or a deeper retracement before the longer-term bull trend resumes.
Written by Razan Hilal, CMT
Follow on X: @Rh_waves
Latest market news




Open an account in minutes
Experience award-winning platforms with fast and secure execution, and enjoy tight spreads from 0.5 pts on FX and 0.3 pts on indices.
Economic calendar
Web Trader platform
Our sophisticated web-based platform is packed with features.
Related articles
Japanese Yen Forecast: USD/JPY 4% Rally Challenges Post-Intervention Downtrend 9 24 2026
USD/JPY momentum has shifted sharply higher, putting a major resistance confluence in focus as U.S. and Japanese event risk builds.

Oil Quietly Hands the Fed a Reason to Stay Hawkish
Oil prices and the U.S. dollar are both on the front foot as elevated energy costs feed Fed warnings that inflation may prove sticky.

S&P 500 forecast: Stocks extend drop as correction risks grow
US and global equity markets have extended Wednesday’s sell-off, with Wall Street opening lower after a weak handover from Asia and Europe. The deterioration in risk appetite has been spreading across global markets. The dollar was firmer, Treasury yields were holding onto yesterday’s gains, while gold, silver and bitcoin were all under pressure alongside equities and major currencies.
This report is intended for general circulation only. It should not be construed as a recommendation, or an offer (or solicitation of an offer) to buy or sell any financial products. The information provided does not take into account your specific investment objectives, financial situation or particular needs. Before you act on any recommendation that may be contained in this report, independent advice ought to be sought from a financial adviser regarding the suitability of the investment product, taking into account your specific investment objectives, financial situation or particular needs.
StoneX Financial Pte. Ltd., may distribute reports produced by its respective foreign entities or affiliates within the StoneX group of companies or third parties pursuant to an arrangement under Regulation 32C of the Financial Advisers Regulations. Where the report is distributed to a person in Singapore who is not an accredited investor, expert investor or an institutional investor (as defined in the Securities Futures Act), StoneX Financial Pte. Ltd. accepts legal responsibility to such persons for the contents of the report only to the extent required by law. Singapore recipients should contact StoneX Financial Pte. Ltd. at 6826 9988 for matters arising from, or in connection with the report.
In the case of all other recipients of this report, to the extent permitted by applicable laws and regulations neither StoneX Financial Pte. Ltd. nor its associated companies will be responsible or liable for any loss or damage incurred arising out of, or in connection with, any use of the information contained in this report and all such liability is hereby expressly disclaimed. No representation or warranty is made, express or implied, that the content of this report is complete or accurate.
StoneX Financial Pte. Ltd. is not under any obligation to update this report.
Trading CFDs carries a high level of risk that may not be suitable for some investors. Consider your investment objectives, level of experience, financial resources, risk appetite and other relevant circumstances carefully. The possibility exists that you could lose some or all of your investments, including your initial deposits. If in doubt, please seek independent expert advice. Visit www.forex.com/en-sg/terms-and-policies for the complete Risk Disclosure Statement.