



Gold bull flagging
Following the burst of momentum in the summer months, gold has endured a rather ugly – if still volatile – couple of months in September and October.
Share this:

Following the burst of momentum in the summer months, gold has endured a rather ugly – if still volatile – couple of months in September and October. In part, the recent struggles can be explained away by increased optimism that the US-China trade situation and Brexit stalemate could soon be over, reducing safe-haven demand. In addition, you have profit-taking from overbought levels also applying a bit of downward pressure. All told however, with central banks still in easing mode and geopolitical risks remaining elevated, the long-term outlook remains positive for the commodity.
Indeed, even if the US-China were to end their trade war, this won’t necessarily be a bad thing, as the prospects of raised physical demand from one of, if not the, largest gold consumer nations may keep prices support. In fact, investor interest in gold has already been rising steadily over the past few months. According to the World Gold Council, global gold-backed ETFs and similar products had $3.9bn of net inflows across all regions in September. This meant, collective gold holdings increased to 2,808 tonnes, the highest of all time, thus surpassing the late 2012 levels, when gold was trading near $1,700. If ETF holdings are anything to go by, then gold could rise at least another $200 from current levels. But obviously it is not as simple as that, as the other variables impacting prices now are different to those in 2012.
From a technical point of view, gold’s sharp gains in the middle of this year undoubtedly caused prices to become overbought. But now we are seeing the longer-term momentum oscillators such as the Relative Strength Index (RSI) on the weekly chart slowly work off their overbought conditions, crucially through time rather than price action. This is a good sign as it indicates gold is holding near the highs without giving back much. With the RSI no longer being overbought on the weekly time frame, the long-term uptrend could soon resume. The precious metal is currently stuck inside a bull flag pattern. It is likely that we will see fresh technical momentum buying should prices beak out of this bullish continuation pattern in the coming days or weeks. But before the breakout can potentially occur, we can’t rule out the prospects of further short-term pain for the bulls. The point of breakout is around $1510-20. So, while it remains below here, we are neutral. If and when gold breaks above here, then we will turn bullish.
Indeed, the long-term momentum has been bullish for gold. Although the metal fell in September, it is currently holding in the positive territory so far this month. Prior to September’s drop, gold had:
- rallied for 4 consecutive months,
- risen for 8 out of the past 12 months,
- broken out of a 6-year old consolidation, and
- taken out numerous resistance levels and moving averages.
So, due to the above reasons, we favour looking for bullish rather than bearish price patterns to emerge going forward. That said, the bulls must show up and soon, before we reinstate our bullish view.

Source: eSignal and City Index.
Following the burst of momentum in the summer months, gold has endured a rather ugly – if still volatile – couple of months in September and October. In part, the recent struggles can be explained away by increased optimism that the US-China trade situation and Brexit stalemate could soon be over, reducing safe-haven demand. In addition, you have profit-taking from overbought levels also applying a bit of downward pressure. All told however, with central banks still in easing mode and geopolitical risks remaining elevated, the long-term outlook remains positive for the commodity.
Indeed, even if the US-China were to end their trade war, this won’t necessarily be a bad thing, as the prospects of raised physical demand from one of, if not the, largest gold consumer nations may keep prices support. In fact, investor interest in gold has already been rising steadily over the past few months. According to the World Gold Council, global gold-backed ETFs and similar products had $3.9bn of net inflows across all regions in September. This meant, collective gold holdings increased to 2,808 tonnes, the highest of all time, thus surpassing the late 2012 levels, when gold was trading near $1,700. If ETF holdings are anything to go by, then gold could rise at least another $200 from current levels. But obviously it is not as simple as that, as the other variables impacting prices now are different to those in 2012.
From a technical point of view, gold’s sharp gains in the middle of this year undoubtedly caused prices to become overbought. But now we are seeing the longer-term momentum oscillators such as the Relative Strength Index (RSI) on the weekly chart slowly work off their overbought conditions, crucially through time rather than price action. This is a good sign as it indicates gold is holding near the highs without giving back much. With the RSI no longer being overbought on the weekly time frame, the long-term uptrend could soon resume. The precious metal is currently stuck inside a bull flag pattern. It is likely that we will see fresh technical momentum buying should prices beak out of this bullish continuation pattern in the coming days or weeks. But before the breakout can potentially occur, we can’t rule out the prospects of further short-term pain for the bulls. The point of breakout is around $1510-20. So, while it remains below here, we are neutral. If and when gold breaks above here, then we will turn bullish.
Indeed, the long-term momentum has been bullish for gold. Although the metal fell in September, it is currently holding in the positive territory so far this month. Prior to September’s drop, gold had:
- rallied for 4 consecutive months,
- risen for 8 out of the past 12 months,
- broken out of a 6-year old consolidation, and
- taken out numerous resistance levels and moving averages.
So, due to the above reasons, we favour looking for bullish rather than bearish price patterns to emerge going forward. That said, the bulls must show up and soon, before we reinstate our bullish view.
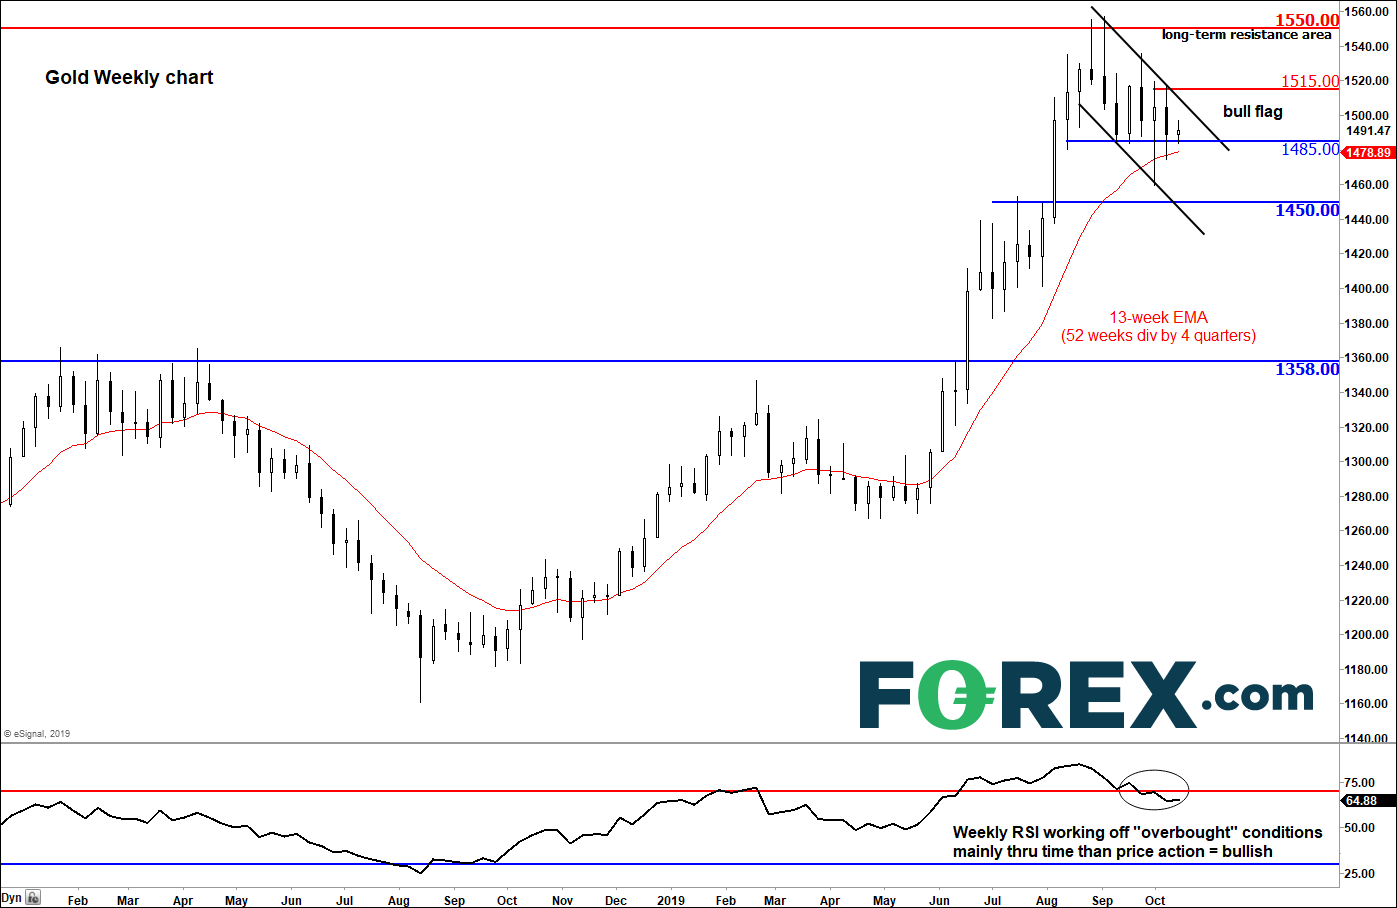
Source: eSignal and FOREX.com.
Related tags:
Latest market news




Open an account in minutes
Experience award-winning platforms with fast and secure execution, and enjoy tight spreads from 0.5 pts on FX and 0.3 pts on indices.
Economic calendar
Web Trader platform
Our sophisticated web-based platform is packed with features.
Related articles

Gold forecast: XAU/USD could take a larger dive after the big rise in yields
Gold prices have been falling in the last few days after last week’s post-FOMC pop faded amid rising interest rate expectations, higher oil prices and a strengthening US dollar. As before, I wasn’t convinced gold would thrive in the current macro backdrop.


Gold, silver slammed as hawkish Fed repricing reignites dollar upside
Gold and silver had held up surprisingly well against surging US yields. Wednesday’s DXY breakout may have changed that equation.


Gold Analysis: Rising Yields and Dollar Strength Weigh on XAU/USD
The trading week continues, and for now gold remains under notable pressure in the short term. This can be seen in the performance of XAU/USD over the last three trading sessions, where the metal has declined by more than 2.00%, bringing a bearish bias back into focus after it had lost momentum in recent weeks.

This report is intended for general circulation only. It should not be construed as a recommendation, or an offer (or solicitation of an offer) to buy or sell any financial products. The information provided does not take into account your specific investment objectives, financial situation or particular needs. Before you act on any recommendation that may be contained in this report, independent advice ought to be sought from a financial adviser regarding the suitability of the investment product, taking into account your specific investment objectives, financial situation or particular needs.
StoneX Financial Pte. Ltd., may distribute reports produced by its respective foreign entities or affiliates within the StoneX group of companies or third parties pursuant to an arrangement under Regulation 32C of the Financial Advisers Regulations. Where the report is distributed to a person in Singapore who is not an accredited investor, expert investor or an institutional investor (as defined in the Securities Futures Act), StoneX Financial Pte. Ltd. accepts legal responsibility to such persons for the contents of the report only to the extent required by law. Singapore recipients should contact StoneX Financial Pte. Ltd. at 6826 9988 for matters arising from, or in connection with the report.
In the case of all other recipients of this report, to the extent permitted by applicable laws and regulations neither StoneX Financial Pte. Ltd. nor its associated companies will be responsible or liable for any loss or damage incurred arising out of, or in connection with, any use of the information contained in this report and all such liability is hereby expressly disclaimed. No representation or warranty is made, express or implied, that the content of this report is complete or accurate.
StoneX Financial Pte. Ltd. is not under any obligation to update this report.
Trading CFDs carries a high level of risk that may not be suitable for some investors. Consider your investment objectives, level of experience, financial resources, risk appetite and other relevant circumstances carefully. The possibility exists that you could lose some or all of your investments, including your initial deposits. If in doubt, please seek independent expert advice. Visit www.forex.com/en-sg/terms-and-policies for the complete Risk Disclosure Statement.