





Gold Price Forecast: Evening Star on Weekly - Can Bears Make a Mark?
Gold has finally strung together two consecutive red weeks for the first time in 2025, building an evening star formation along the way. The question now is whether sellers can seize the day.
Share this:

Gold Talking Points:
- After only two red weeks in the first 16 of 2025, bears have finally strung together two consecutive weeks of losses with price taking on an evening star pattern following the $3500 test.
- The FOMC rate decision looms large for next week but also of interest is the USD and the possibility of a near-term low being in-place. If we do see bulls continue to push in DXY that could further support the backdrop for a larger pullback in gold.
Gold is posting its second consecutive weekly loss for the first time in 2025 trade and this stands in stark contrast to the trend that developed around the start of the year. Gold prices had spent two months digesting in late-2024 trade but after buyers pushed the breakout, there was a strong directional move that held through the first four months of the year.
While the $3k level was a mere speedbump in March and April, so far, it’s been the $3500 level that’s drawn a line-in-the-sand. Bulls pushed that test the week before last but it didn’t hold for long, as profit taking took over shortly thereafter.
Bulls weren’t deterred, at least initially, as supports continued to hold even through early-trade last week. It was the continued sell-off on Thursday and Friday, after the May open, that started to open the door for deeper pullback potential. At this point, the weekly chart is showing an evening star pattern, often approached with aim of bearish reversal.
The pattern is a three-bar sequence, with a bullish candle followed by a show of indecision, often a doji, and that’s followed by a bearish candle that erases at least half of candle body one. With the $3500 level marking the high it becomes clear why, and how, such a formation comes to life.
Immediate support is at the $3200 level, which I’ll look at deeper below.
Gold Weekly Price Chart
 Chart prepared by James Stanley; data derived from Tradingview
Gold Daily: Cash Crunch
It was the massive sell-off in USD that was driving so much interest behind the long side of gold. The tariff drama brought upon questions of ‘de-dollarization’ and it’s perhaps no coincidence that the high in gold at $3500 printed right around the time that DXY ran into a major level of long-term support.
The Dollar has since bounced and as of this writing appears to be trying to string together another higher-low to go along with the prior higher-high. This sets up for the FOMC rate decision on Wednesday and naturally that has some interest for gold.
From the daily chart of gold we can see a similar development in a short-term trend with Thursday and Friday’s lower-low to go along with the prior lower-high. So far, the $3200 level has been defended and that’s the next major level in the sand for gold. Below that, there’s a support zone as derived from prior resistance, around 3149-3167.
Gold Daily Chart
 Chart prepared by James Stanley; data derived from Tradingview
Gold: The Bearish Scenario
Given the early nature of this recent sell-off, I wanted to look at a bearish scenario in gold as what would likely be needed to bring it to fruition. USD strength would probably be a necessity, and this would likely need some element of hawkishness at the FOMC rate decision on Wednesday. This doesn’t sound all too outlandish, to me, especially given the Fed’s prior reticence to lean dovish in consideration of inflationary potential from tariffs.
For gold, the bigger question in my mind is whether we see bulls stage a defense from a deeper support level, perhaps the 3057 prior swing-high, or maybe even the $3k level which, technically, could still constitute a higher-lower above the early April swing low.
At this point from the four-hour chart, there’s now a sequence of lower-lows and lower-highs to work with and that provides some structure to work with for pullback scenarios into next week.
Gold Four-Hour Chart
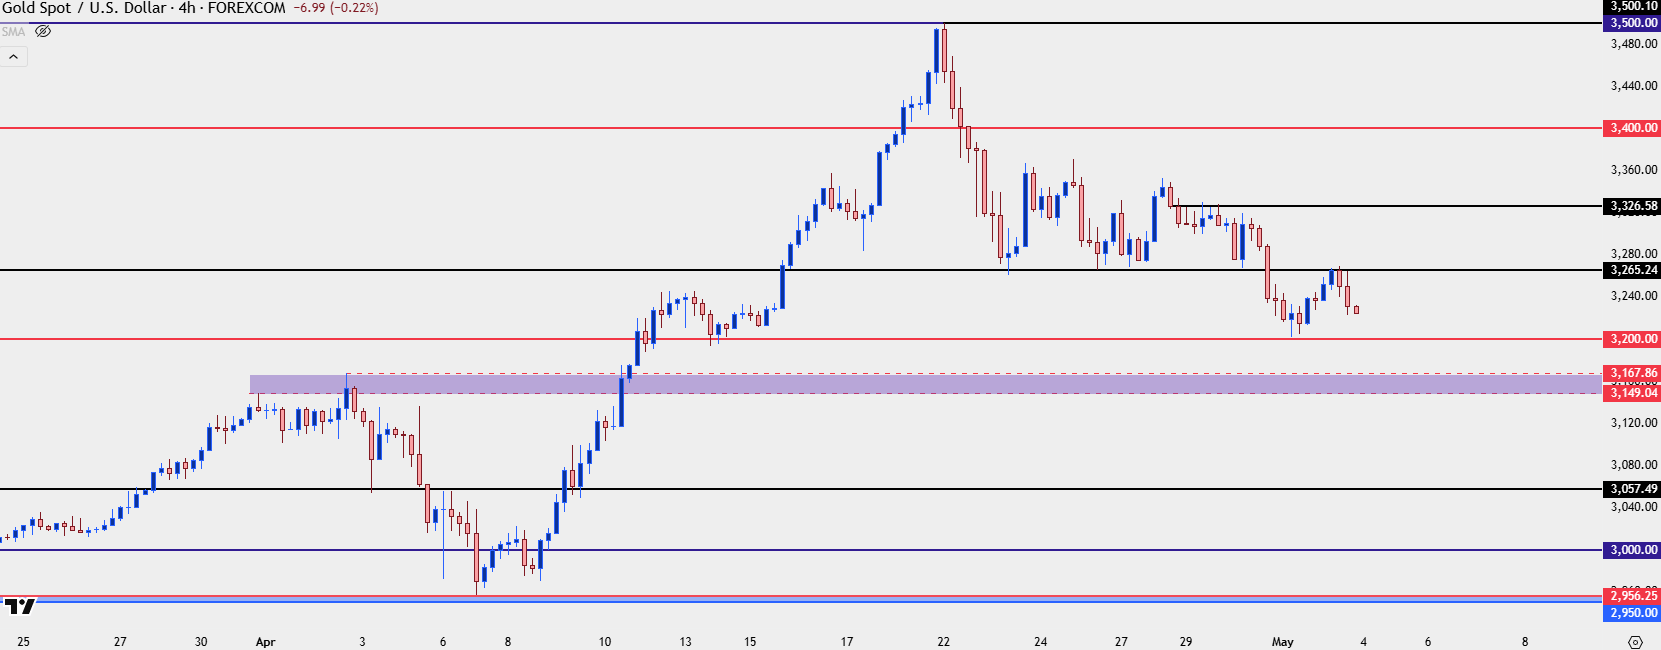 Chart prepared by James Stanley; data derived from Tradingview
Gold: The Bullish Scenario
This side is a little more difficult to entertain and I think that’s simply because it goes against the grain of the past couple of weeks. But we would probably also want to define what success for bulls would mean, as in are we talking about a break of the $3500 level or simply a green bar for next week? The former would equate to a failure of the evening star while the latter could remain in the context of that formation.
For a break of $3500 we’re likely going to need an extremely weak US Dollar and for that, I’d imagine that the Fed would need to sound very dovish at next week’s meeting. That’s something I have a difficult time expecting given how they’ve refrained from a dovish tilt given their fears of inflation over tariffs.
For a green weekly bar, we would simply need to see bulls put up a fight at support which seems a more reasonable prospect, but it would probably also need to be accompanied by some element of weakness in the USD.
At this stage, between the two scenarios above, the bearish backdrop in gold appears more attractive to me but I’d still hesitate from trying to get too bearish just yet, as the possibility of bulls putting up a push at support remains a key risk. Looking to or for lower-high resistance at 3265 or 3326 could remain attractive prospects, and if we do see prices slide below 3200, that becomes a spot for lower-high resistance, as well.
--- written by James Stanley, Senior Strategist
Gold Talking Points:
- After only two red weeks in the first 16 of 2025, bears have finally strung together two consecutive weeks of losses with price taking on an evening star pattern following the $3500 test.
- The FOMC rate decision looms large for next week but also of interest is the USD and the possibility of a near-term low being in-place. If we do see bulls continue to push in DXY that could further support the backdrop for a larger pullback in gold.
Gold is posting its second consecutive weekly loss for the first time in 2025 trade and this stands in stark contrast to the trend that developed around the start of the year. Gold prices had spent two months digesting in late-2024 trade but after buyers pushed the breakout, there was a strong directional move that held through the first four months of the year.
While the $3k level was a mere speedbump in March and April, so far, it’s been the $3500 level that’s drawn a line-in-the-sand. Bulls pushed that test the week before last but it didn’t hold for long, as profit taking took over shortly thereafter.
Bulls weren’t deterred, at least initially, as supports continued to hold even through early-trade last week. It was the continued sell-off on Thursday and Friday, after the May open, that started to open the door for deeper pullback potential. At this point, the weekly chart is showing an evening star pattern, often approached with aim of bearish reversal.
The pattern is a three-bar sequence, with a bullish candle followed by a show of indecision, often a doji, and that’s followed by a bearish candle that erases at least half of candle body one. With the $3500 level marking the high it becomes clear why, and how, such a formation comes to life.
Immediate support is at the $3200 level, which I’ll look at deeper below.
Gold Weekly Price Chart
Chart prepared by James Stanley; data derived from Tradingview
Gold Daily: Cash Crunch
It was the massive sell-off in USD that was driving so much interest behind the long side of gold. The tariff drama brought upon questions of ‘de-dollarization’ and it’s perhaps no coincidence that the high in gold at $3500 printed right around the time that DXY ran into a major level of long-term support.
The Dollar has since bounced and as of this writing appears to be trying to string together another higher-low to go along with the prior higher-high. This sets up for the FOMC rate decision on Wednesday and naturally that has some interest for gold.
From the daily chart of gold we can see a similar development in a short-term trend with Thursday and Friday’s lower-low to go along with the prior lower-high. So far, the $3200 level has been defended and that’s the next major level in the sand for gold. Below that, there’s a support zone as derived from prior resistance, around 3149-3167.
Gold Daily Chart
Chart prepared by James Stanley; data derived from Tradingview
Gold: The Bearish Scenario
Given the early nature of this recent sell-off, I wanted to look at a bearish scenario in gold as what would likely be needed to bring it to fruition. USD strength would probably be a necessity, and this would likely need some element of hawkishness at the FOMC rate decision on Wednesday. This doesn’t sound all too outlandish, to me, especially given the Fed’s prior reticence to lean dovish in consideration of inflationary potential from tariffs.
For gold, the bigger question in my mind is whether we see bulls stage a defense from a deeper support level, perhaps the 3057 prior swing-high, or maybe even the $3k level which, technically, could still constitute a higher-lower above the early April swing low.
At this point from the four-hour chart, there’s now a sequence of lower-lows and lower-highs to work with and that provides some structure to work with for pullback scenarios into next week.
Gold Four-Hour Chart
Chart prepared by James Stanley; data derived from Tradingview
Gold: The Bullish Scenario
This side is a little more difficult to entertain and I think that’s simply because it goes against the grain of the past couple of weeks. But we would probably also want to define what success for bulls would mean, as in are we talking about a break of the $3500 level or simply a green bar for next week? The former would equate to a failure of the evening star while the latter could remain in the context of that formation.
For a break of $3500 we’re likely going to need an extremely weak US Dollar and for that, I’d imagine that the Fed would need to sound very dovish at next week’s meeting. That’s something I have a difficult time expecting given how they’ve refrained from a dovish tilt given their fears of inflation over tariffs.
For a green weekly bar, we would simply need to see bulls put up a fight at support which seems a more reasonable prospect, but it would probably also need to be accompanied by some element of weakness in the USD.
At this stage, between the two scenarios above, the bearish backdrop in gold appears more attractive to me but I’d still hesitate from trying to get too bearish just yet, as the possibility of bulls putting up a push at support remains a key risk. Looking to or for lower-high resistance at 3265 or 3326 could remain attractive prospects, and if we do see prices slide below 3200, that becomes a spot for lower-high resistance, as well.
--- written by James Stanley, Senior Strategist
Related tags:
Latest market news




Open an account in minutes
Experience award-winning platforms with fast and secure execution, and enjoy tight spreads from 0.5 pts on FX and 0.3 pts on indices.
Economic calendar
Web Trader platform
Our sophisticated web-based platform is packed with features.
Related articles
Japanese Yen Technical Analysis: USD/JPY Support Test into Core PCE
USD/JPY has been a battlefield for the past two months as the force of intervention and the threat of more have given sellers an advantage, even as buyers have continued to bid support on pullbacks. This sets the stage for a massive finish to the week with Core PCE and Non-farm Payrolls.
Euro Forecast: EUR/USD Tumbles Towards Yearly Low as Daily RSI Goes Oversold
EUR/USD has been hit hard in the final month of the quarter as USD strength has shown up in a big way. With the pair set to challenge its yearly low as RSI has pushed into oversold territory, is there a chance for a pullback with some big headline risk hitting in the US over the next few days?

USD into a Massive Week as Yields Fly and Gold Breaks
It’s a huge week with PCE and NFP, but it’s what’s happening off of the calendar that demands attention with US yields flying to fresh multi-decade highs.
This report is intended for general circulation only. It should not be construed as a recommendation, or an offer (or solicitation of an offer) to buy or sell any financial products. The information provided does not take into account your specific investment objectives, financial situation or particular needs. Before you act on any recommendation that may be contained in this report, independent advice ought to be sought from a financial adviser regarding the suitability of the investment product, taking into account your specific investment objectives, financial situation or particular needs.
StoneX Financial Pte. Ltd., may distribute reports produced by its respective foreign entities or affiliates within the StoneX group of companies or third parties pursuant to an arrangement under Regulation 32C of the Financial Advisers Regulations. Where the report is distributed to a person in Singapore who is not an accredited investor, expert investor or an institutional investor (as defined in the Securities Futures Act), StoneX Financial Pte. Ltd. accepts legal responsibility to such persons for the contents of the report only to the extent required by law. Singapore recipients should contact StoneX Financial Pte. Ltd. at 6826 9988 for matters arising from, or in connection with the report.
In the case of all other recipients of this report, to the extent permitted by applicable laws and regulations neither StoneX Financial Pte. Ltd. nor its associated companies will be responsible or liable for any loss or damage incurred arising out of, or in connection with, any use of the information contained in this report and all such liability is hereby expressly disclaimed. No representation or warranty is made, express or implied, that the content of this report is complete or accurate.
StoneX Financial Pte. Ltd. is not under any obligation to update this report.
Trading CFDs carries a high level of risk that may not be suitable for some investors. Consider your investment objectives, level of experience, financial resources, risk appetite and other relevant circumstances carefully. The possibility exists that you could lose some or all of your investments, including your initial deposits. If in doubt, please seek independent expert advice. Visit www.forex.com/en-sg/terms-and-policies for the complete Risk Disclosure Statement.