



Gold Price Rebound? Futures Positioning Signals Support Above 4,000
Gold's selloff may be nearing exhaustion as futures positioning improves, bearish bets collapse and support above 4,000 continues to hold.
Share this:

Gold prices are on track for a fourth consecutive monthly decline, yet several indicators suggest bearish momentum may be fading. Extreme seasonality readings, improving futures positioning and resilient options market sentiment all point to the potential for another rebound while support above 4,000 remains intact.
View related analysis:
View related analysis:
Gold Holds Above 4,000 as Positioning and Technical Signals Improve
Gold Bulls To Eye Another Rebound?
On June 11, I outlined the case for a bullish mean-reversion move in gold. At the time, I noted that gold prices had fallen more than 10% in June, far exceeding the average decline of -3.5% seen during bearish Junes since 2000. And that was before the month had reached its halfway point. With the 4,000 milestone providing nearby support, the odds appeared to favour a rebound. I'm pleased to say the low was identified to the day, and a similar setup now appears to be emerging.
Gold remains on track for a fourth consecutive monthly decline — its longest bearish streak since September 2022. Yet it is once again lower by more than 10% for the month, putting it on course for its second-worst monthly performance of the century. At the same time, monthly volatility continues to trend lower despite elevated price swings, which could be interpreted as a crude sign that conditions are becoming more stable.
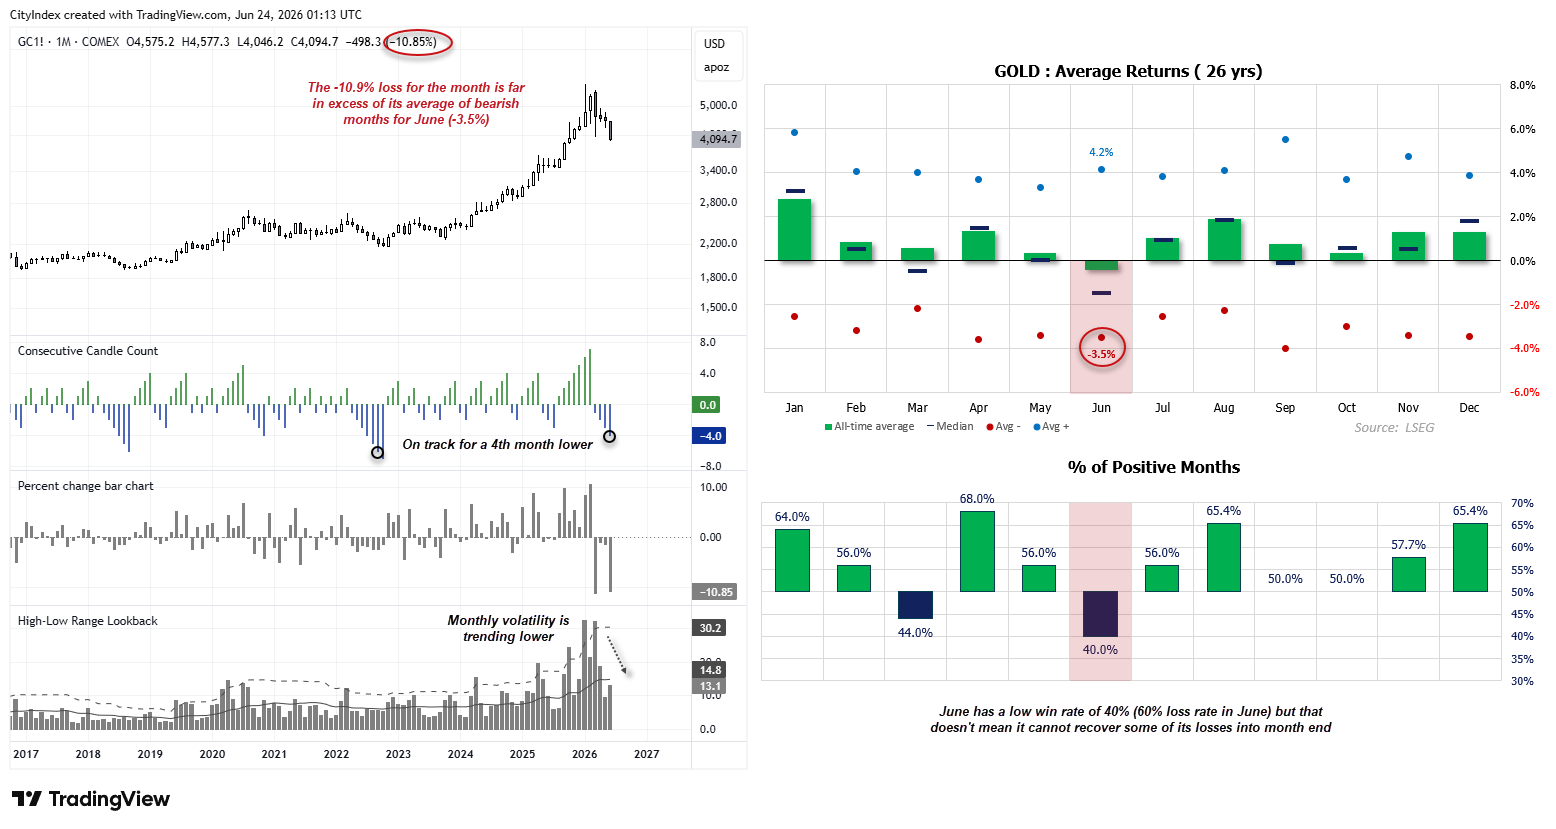
Source: COMES, TradingView, LSEG
Gold's June Decline Stretches Historical Extremes
Seasonality shows June is typically a bearish month for gold, delivering a negative average and median return alongside a relatively low win rate. Since 2000, gold has declined in 60% of Junes, with those bearish months posting an average return of -3.5%. Therefore, the fact that gold is already down more than 10% this month while continuing to hold above support suggests it may be able to claw back at least some of those losses before month-end.

Gold Futures (GC) Market Positioning | COT Report
Gold Shorts Collapse as Positioning Improves
It should also be noted that bearish bets against gold have collapsed on the CME futures market. Gross shorts among managed funds have fallen to their lowest level since 2022, while large speculators hold their fewest short positions since January 2025. Although gross longs remain low by historical standards, they have been gradually increasing, helping to lift net-long exposure among both groups.
Open interest has also trended lower in recent months, suggesting the decline in gold prices was not primarily driven by aggressive new short selling. Instead, the move appears to have been characterised by both long and short positions being unwound. However, total open interest has edged higher over the past couple of weeks, hinting at potential accumulation as gold continues to hold above the 4,000 level.
For traders wanting a deeper understanding of futures positioning, I’ve also published a guide on how to read and interpret weekly COT data in forex markets.
For traders wanting a deeper understanding of futures positioning, I’ve also published a guide on how to read and interpret weekly COT data in forex markets.
Options Markets Hint at Underlying Resilience
Furthermore, risk reversals remain above their recent lows and trade at higher levels relative to those lows compared with prices. This could be deemed a positive divergence between options traders and spot gold prices. Ultimately, demand for puts relative to calls is nowhere near as strong as it was a few weeks ago. Which again, provides a clue that gold may not be ready to break below 4,000.
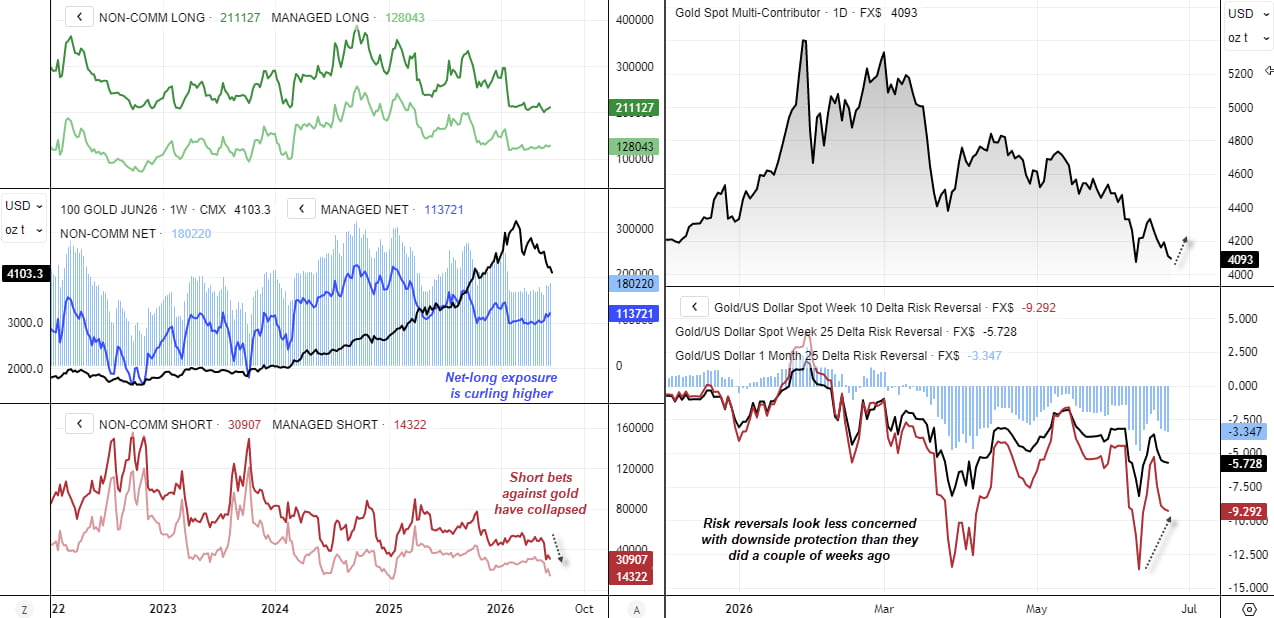
Source: CFTC (COT), COMEX, LSEG
This content was created by an affiliate of FOREX.com and represents the views and opinions of the author/speakers, not the views and opinions of FOREX.com, StoneX Group Inc., or its subsidiaries. The content has not been independently reviewed by FOREX.com.
Gold Futures (GC) Technical Analysis
The daily chart shows prices have pulled back from the rebound towards 4,400, although downside momentum appears to be fading and the daily RSI (2) is oversold. If gold can hold above the October low into today's close, it would confirm a higher low and provide a bullish signal for the near term. While the US dollar continues to rally, it is also approaching key resistance levels of its own, raising the possibility that gold could establish a trough above 4,000.
The 1-hour chart shows prices attempting to hold above the daily VPOC (volume point of control). Bulls may want to wait for stronger evidence that a swing low has formed, but while gold remains above 4,000, the potential remains for a rebound towards 4,200, 4,300, or even the 4,400 high. Such a move could unfold while the broader bearish trend on the daily chart remains intact.
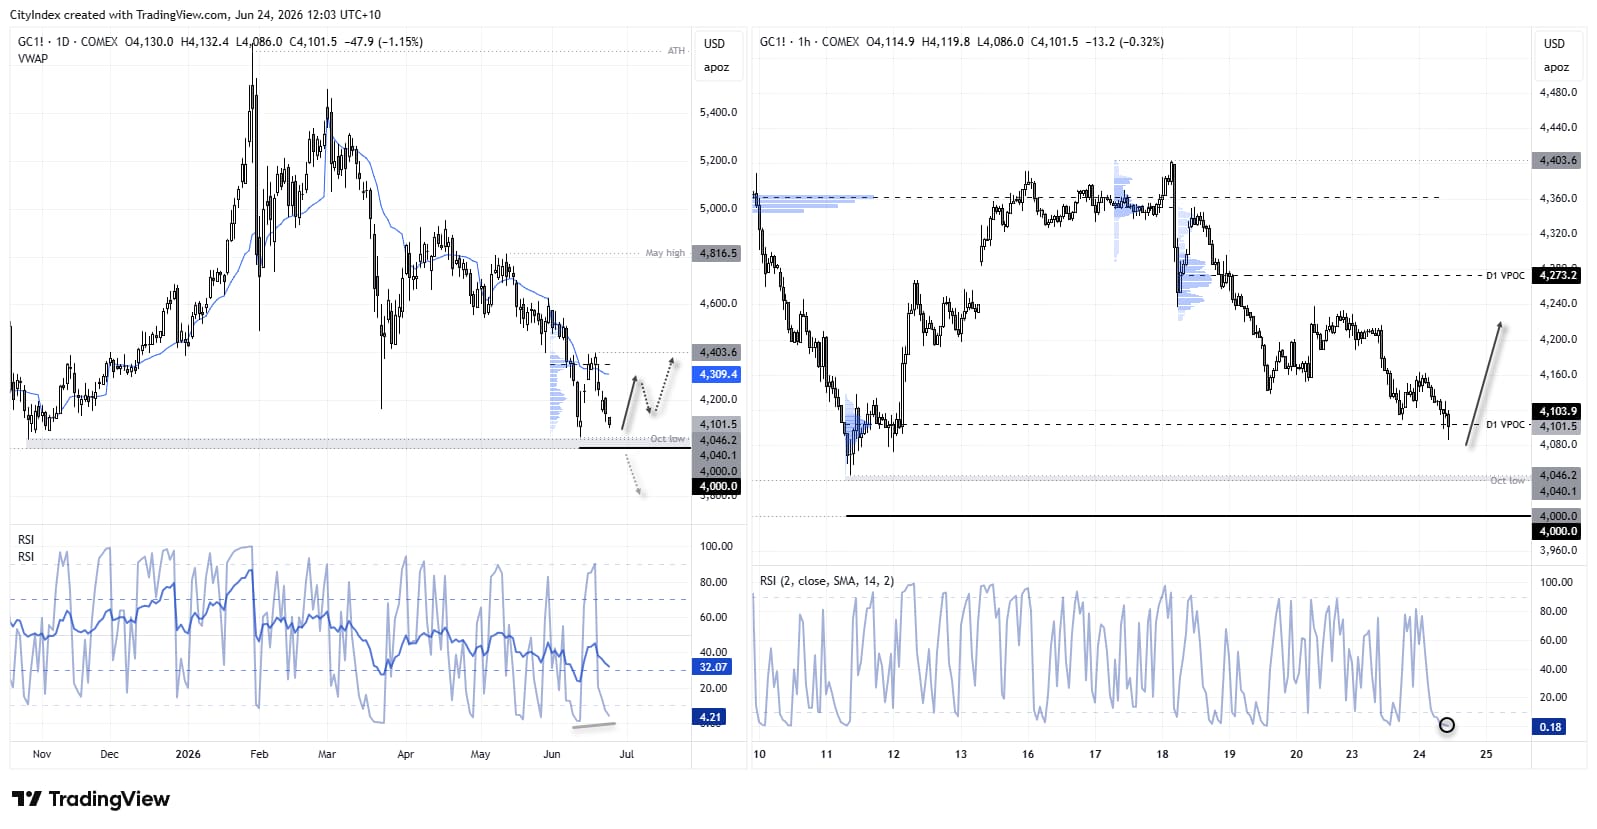
Source: COMEX, TradingView
Related tags:
Latest market news




Open an account in minutes
Experience award-winning platforms with fast and secure execution, and enjoy tight spreads from 0.5 pts on FX and 0.3 pts on indices.
Economic calendar
Web Trader platform
Our sophisticated web-based platform is packed with features.
Related articles
EUR/USD weekly outlook: FOMC and ECB to set the tone
The current backdrop is modestly bearish. On Friday, the EUR/USD closed modestly lower, down for the third consecutive day. The pair also posted a weekly decline after staging a modest recovery attempt in the previous week. Out of the past 8 weeks, the EUR/USD has fallen on 6 occasions. There is not much supporting factors for the single currency right now. So, the upside remains capped.
Gold Does Something it Hasn’t Done in a Year, is Larger Risk-Off Afoot?
With tech stocks getting hit harder last week there was collateral damage elsewhere, including gold as the metal closed below the $4k level for the week and that’s the first time that’s happened to spot gold in more than a year.


Silver forecast: metals liquidation drags XAG/USD into $50-55 support
Silver has broken its July low and slipped into a long-term support zone as the selling in precious metals deepens. The chart shows where the metal could bottom, and next week's Fed decision may decide whether it does.
This report is intended for general circulation only. It should not be construed as a recommendation, or an offer (or solicitation of an offer) to buy or sell any financial products. The information provided does not take into account your specific investment objectives, financial situation or particular needs. Before you act on any recommendation that may be contained in this report, independent advice ought to be sought from a financial adviser regarding the suitability of the investment product, taking into account your specific investment objectives, financial situation or particular needs.
StoneX Financial Pte. Ltd., may distribute reports produced by its respective foreign entities or affiliates within the StoneX group of companies or third parties pursuant to an arrangement under Regulation 32C of the Financial Advisers Regulations. Where the report is distributed to a person in Singapore who is not an accredited investor, expert investor or an institutional investor (as defined in the Securities Futures Act), StoneX Financial Pte. Ltd. accepts legal responsibility to such persons for the contents of the report only to the extent required by law. Singapore recipients should contact StoneX Financial Pte. Ltd. at 6826 9988 for matters arising from, or in connection with the report.
In the case of all other recipients of this report, to the extent permitted by applicable laws and regulations neither StoneX Financial Pte. Ltd. nor its associated companies will be responsible or liable for any loss or damage incurred arising out of, or in connection with, any use of the information contained in this report and all such liability is hereby expressly disclaimed. No representation or warranty is made, express or implied, that the content of this report is complete or accurate.
StoneX Financial Pte. Ltd. is not under any obligation to update this report.
Trading CFDs carries a high level of risk that may not be suitable for some investors. Consider your investment objectives, level of experience, financial resources, risk appetite and other relevant circumstances carefully. The possibility exists that you could lose some or all of your investments, including your initial deposits. If in doubt, please seek independent expert advice. Visit www.forex.com/en-sg/terms-and-policies for the complete Risk Disclosure Statement.