





Gold Prices Go Parabolic as Macro Risks Rise
Gold prices scaled up to another fresh ATH last week and the metal has shown no sign yet that the move is nearing over.
Share this:

Gold Talking Points:
- Last weekend the fear on social media was a ‘Black Monday’ event at the weekly open after Jerome Powell failed to reiterate the Fed put at his speech. But stocks stabilized last week as a few other items started to show in a concerning manner.
- U.S. Treasury yields spiked aggressively, with the 10-year running from 4% to 4.5%, and the 30-year briefly touching 5%. Gold’s parabolic-like move showed a 9.76% gain at its peak from the weekly low to the weekly high. And the US Dollar put in a nasty bearish move. These are major shifts in some important global markets, and it suggests that we may not yet be out of the woods.
Well, gold’s test below the $3k handle has been short-lived so far. The metal has been on an outlandish run since resolving the bull pennant at the start of the year, and while last Friday’s pullback was sizable, bulls returned earlier this week at a very key spot to continue the trend.
It was the same 2956 level that marked the highs back in February, producing a bit of stall before the first ever test of the $3k marker.
The Monday pullback suddenly stopped at that level and then on Tuesday, sellers were stopped in their tracks as a doji developed on the daily chart, coupled with a higher-low above the Monday swing. It was the rally on Wednesday which was helped along by the Trump twist on tariffs that really started to drive the reversal, and gold continued to gain steam over the next two days until another fresh all-time-high was firmly in-place at 3245.
Gold Daily Price Chart
 Chart prepared by James Stanley; data derived from Tradingview
Gold Bigger Picture
The current trend in gold started just over a year ago, and it was the catalyst to that move that I think remains important today. After resistance at the $2k level for the prior three and a half years, gold spent the first month and a half of 2024 trade holding above the psychological level.
But, the CPI report in February came out above expected and quickly rate cut expectations around the Fed were in question, leading to the first daily close below $2k in gold for the year. A day later, Austan Goolsbee of the Chicago Fed implored market participants to avoid getting ‘flipped out’ about a single inflation print. The day after gold climbed above $2k and never looked back, starting on a 40% rally that ran into late-October.
The move started to stall around the U.S. Presidential election and that’s when a rather clean symmetrical triangle had built, which when taken with the prevailing trend, makes for a bull pennant formation. That formation started to give way as we came into 2025; and just as we had seen in the prior year, bulls took over in a very big way.
At this point there has been only two red weekly candles in gold this year: From the stalled test at 2950 and then again in the prior week. But bulls have continued to push and as I’ve been saying in webinar, there’s little attraction on the bearish side here to me, even if the move is overbought from several different vantage points.
Gold Weekly Price Chart
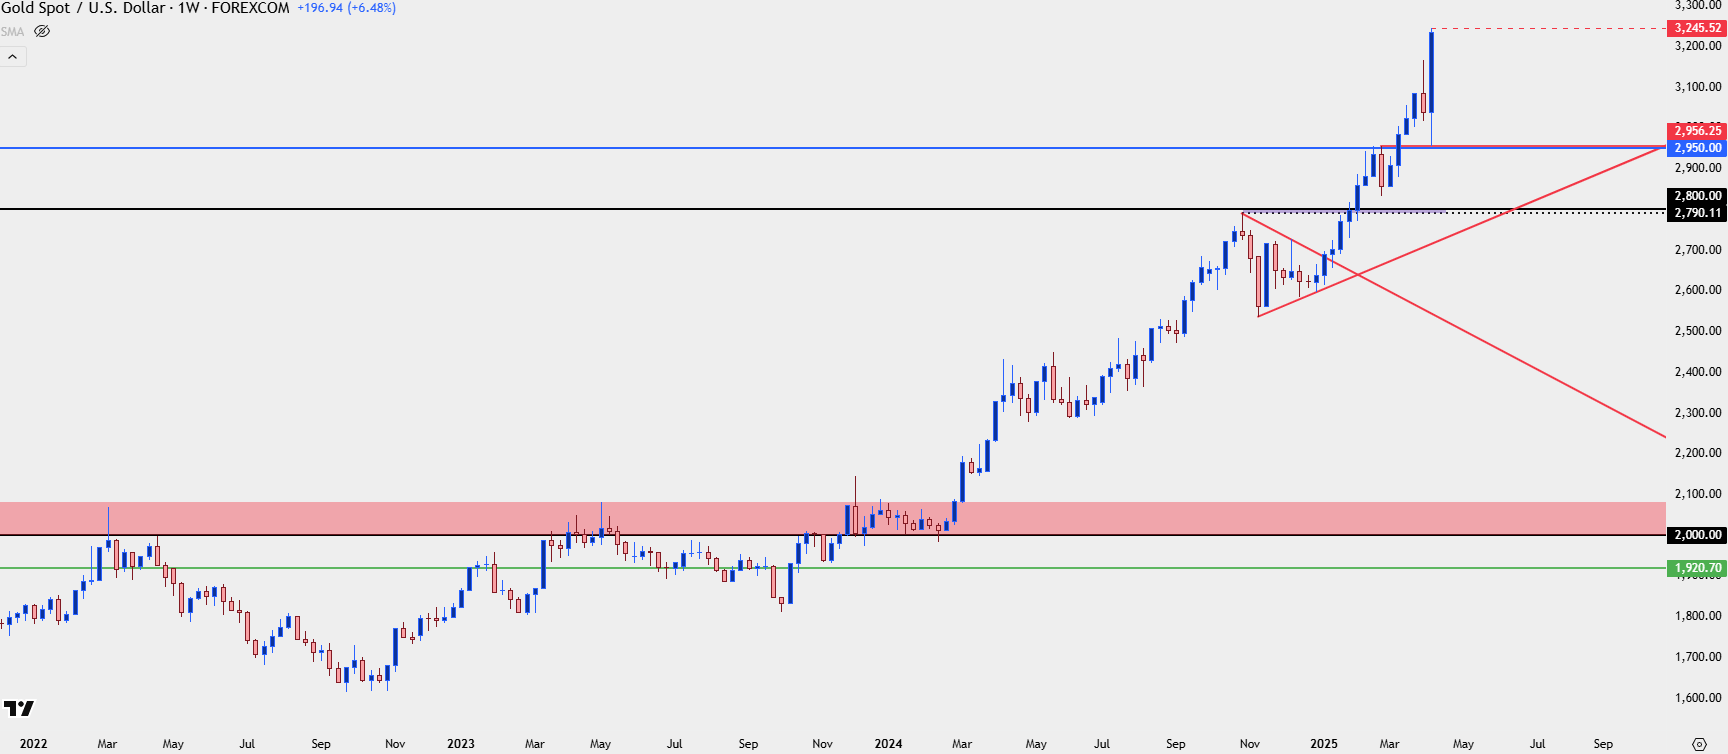 Chart prepared by James Stanley; data derived from Tradingview
Gold: Managing Emotions in a Bubbling Market
I think that psychology is probably one of the most important aspects of a trader’s approach and nothing puts that psychology in the spotlight like a massive one-sided move. The fear of missing out can run high and that innate desire to try to predict price can become quite loud given how aggressively we’ve seen a directional bias price in.
This can make patience an even more difficult premise as price has peeled further and further away from any recent swing lows.
But, interestingly, with moves such as we have in gold the most opportune times are when the desire for trend continuation is at its least attractive, such as what appeared on Tuesday. At that point, there was a clean doji on the daily chart with a higher-low above a key area of support. That indecision followed some pretty aggressive selling, and the trend soon turned as gold bulls piled back in. This doesn’t mean every spot of support will turn into fresh highs, but it does illustrate how patience in waiting for support in bullish trends can be a calculated way of looking to work with the move, especially given the ability to manage risk in a more palatable manner.
At this point, there’s another spot of prior resistance around the 3150 level, which stalled the move around the April open. This was the zone that invariably led to that pullback that ran into last week’s open, and this now becomes the next key spot for bulls to hold on pullback attempts. For more aggressive stances, 3200 is also of interest as this is a rounded level, and if buyers remain quick to respond then a test of 3199 or 3195 would show as a form of relative value, so if there is defense that that could also play as higher-low support potential.
If we see a pullback dig a bit deeper such as what showed in the prior instance, then both 3100 and 3050-3057 both remain in working order for higher-low support potential. Theoretically, price could even spill all the way down to $3k and as long as it holds above that prior swing low of 2956, there could be a bullish argument on the basis of a higher-low support hold.
Gold Four-Hour Price Chart
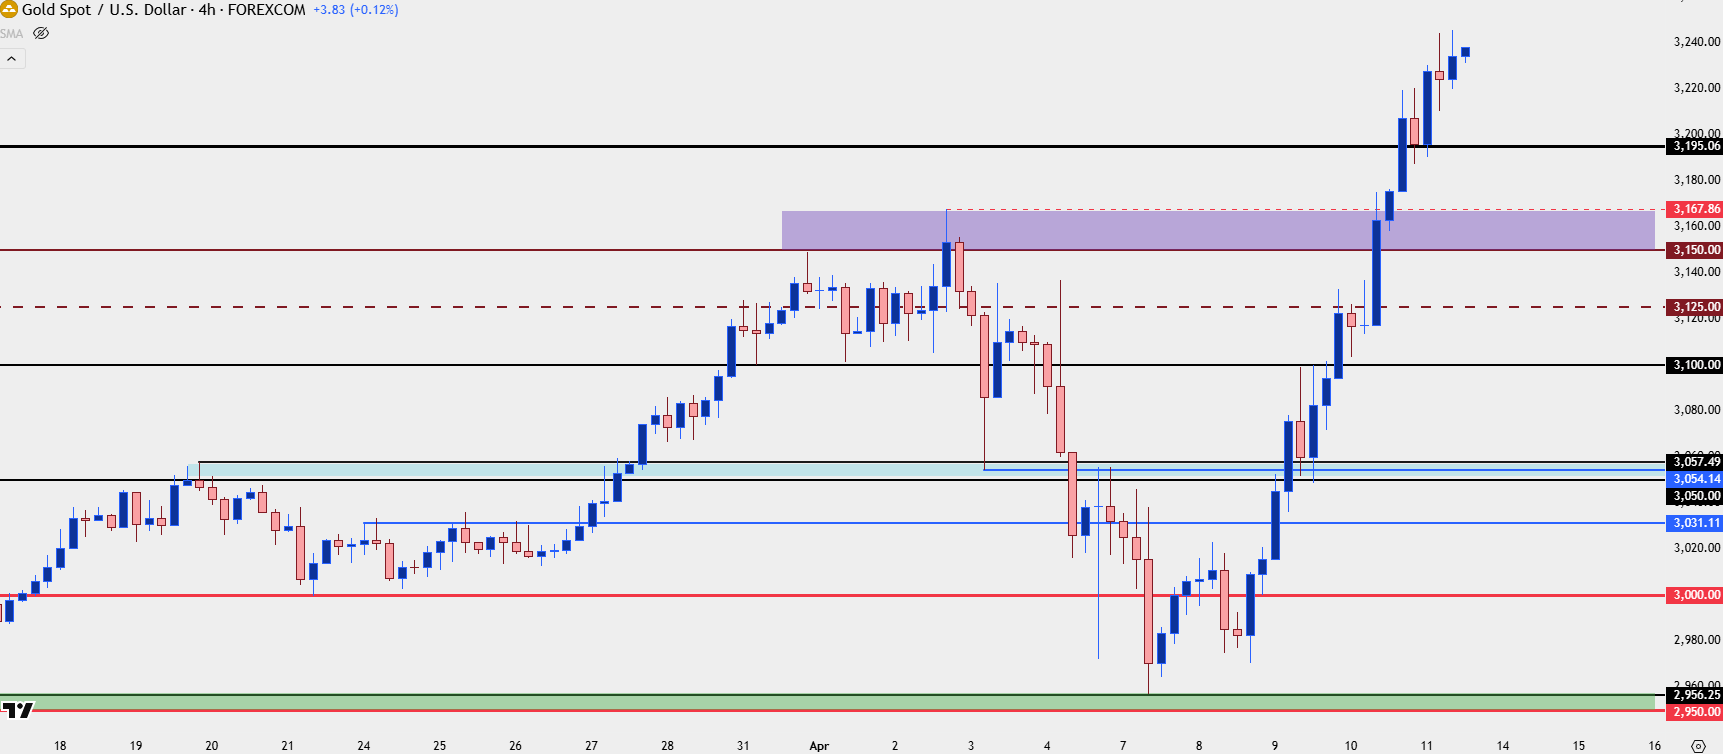 Chart prepared by James Stanley; data derived from Tradingview
--- written by James Stanley, Senior Strategist
Gold Talking Points:
- Last weekend the fear on social media was a ‘Black Monday’ event at the weekly open after Jerome Powell failed to reiterate the Fed put at his speech. But stocks stabilized last week as a few other items started to show in a concerning manner.
- U.S. Treasury yields spiked aggressively, with the 10-year running from 4% to 4.5%, and the 30-year briefly touching 5%. Gold’s parabolic-like move showed a 9.76% gain at its peak from the weekly low to the weekly high. And the US Dollar put in a nasty bearish move. These are major shifts in some important global markets, and it suggests that we may not yet be out of the woods.
Well, gold’s test below the $3k handle has been short-lived so far. The metal has been on an outlandish run since resolving the bull pennant at the start of the year, and while last Friday’s pullback was sizable, bulls returned earlier this week at a very key spot to continue the trend.
It was the same 2956 level that marked the highs back in February, producing a bit of stall before the first ever test of the $3k marker.
The Monday pullback suddenly stopped at that level and then on Tuesday, sellers were stopped in their tracks as a doji developed on the daily chart, coupled with a higher-low above the Monday swing. It was the rally on Wednesday which was helped along by the Trump twist on tariffs that really started to drive the reversal, and gold continued to gain steam over the next two days until another fresh all-time-high was firmly in-place at 3245.
Gold Daily Price Chart
Gold Bigger Picture
The current trend in gold started just over a year ago, and it was the catalyst to that move that I think remains important today. After resistance at the $2k level for the prior three and a half years, gold spent the first month and a half of 2024 trade holding above the psychological level.
But, the CPI report in February came out above expected and quickly rate cut expectations around the Fed were in question, leading to the first daily close below $2k in gold for the year. A day later, Austan Goolsbee of the Chicago Fed implored market participants to avoid getting ‘flipped out’ about a single inflation print. The day after gold climbed above $2k and never looked back, starting on a 40% rally that ran into late-October.
The move started to stall around the U.S. Presidential election and that’s when a rather clean symmetrical triangle had built, which when taken with the prevailing trend, makes for a bull pennant formation. That formation started to give way as we came into 2025; and just as we had seen in the prior year, bulls took over in a very big way.
At this point there has been only two red weekly candles in gold this year: From the stalled test at 2950 and then again in the prior week. But bulls have continued to push and as I’ve been saying in webinar, there’s little attraction on the bearish side here to me, even if the move is overbought from several different vantage points.
Gold Weekly Price Chart
Gold: Managing Emotions in a Bubbling Market
I think that psychology is probably one of the most important aspects of a trader’s approach and nothing puts that psychology in the spotlight like a massive one-sided move. The fear of missing out can run high and that innate desire to try to predict price can become quite loud given how aggressively we’ve seen a directional bias price in.
This can make patience an even more difficult premise as price has peeled further and further away from any recent swing lows.
But, interestingly, with moves such as we have in gold the most opportune times are when the desire for trend continuation is at its least attractive, such as what appeared on Tuesday. At that point, there was a clean doji on the daily chart with a higher-low above a key area of support. That indecision followed some pretty aggressive selling, and the trend soon turned as gold bulls piled back in. This doesn’t mean every spot of support will turn into fresh highs, but it does illustrate how patience in waiting for support in bullish trends can be a calculated way of looking to work with the move, especially given the ability to manage risk in a more palatable manner.
At this point, there’s another spot of prior resistance around the 3150 level, which stalled the move around the April open. This was the zone that invariably led to that pullback that ran into last week’s open, and this now becomes the next key spot for bulls to hold on pullback attempts. For more aggressive stances, 3200 is also of interest as this is a rounded level, and if buyers remain quick to respond then a test of 3199 or 3195 would show as a form of relative value, so if there is defense that that could also play as higher-low support potential.
If we see a pullback dig a bit deeper such as what showed in the prior instance, then both 3100 and 3050-3057 both remain in working order for higher-low support potential. Theoretically, price could even spill all the way down to $3k and as long as it holds above that prior swing low of 2956, there could be a bullish argument on the basis of a higher-low support hold.
Gold Four-Hour Price Chart
--- written by James Stanley, Senior Strategist
Related tags:
Latest market news



Open an account in minutes
Experience award-winning platforms with fast and secure execution, and enjoy tight spreads from 0.5 pts on FX and 0.3 pts on indices.
Economic calendar
Web Trader platform
Our sophisticated web-based platform is packed with features.
Related articles
S&P 500 forecast: Stocks extend drop as correction risks grow
US and global equity markets have extended Wednesday’s sell-off, with Wall Street opening lower after a weak handover from Asia and Europe. The deterioration in risk appetite has been spreading across global markets. The dollar was firmer, Treasury yields were holding onto yesterday’s gains, while gold, silver and bitcoin were all under pressure alongside equities and major currencies.
Gold forecast: XAU/USD could take a larger dive after the big rise in yields
Gold prices have been falling in the last few days after last week’s post-FOMC pop faded amid rising interest rate expectations, higher oil prices and a strengthening US dollar. As before, I wasn’t convinced gold would thrive in the current macro backdrop.

Gold, silver slammed as hawkish Fed repricing reignites dollar upside
Gold and silver had held up surprisingly well against surging US yields. Wednesday’s DXY breakout may have changed that equation.

This report is intended for general circulation only. It should not be construed as a recommendation, or an offer (or solicitation of an offer) to buy or sell any financial products. The information provided does not take into account your specific investment objectives, financial situation or particular needs. Before you act on any recommendation that may be contained in this report, independent advice ought to be sought from a financial adviser regarding the suitability of the investment product, taking into account your specific investment objectives, financial situation or particular needs.
StoneX Financial Pte. Ltd., may distribute reports produced by its respective foreign entities or affiliates within the StoneX group of companies or third parties pursuant to an arrangement under Regulation 32C of the Financial Advisers Regulations. Where the report is distributed to a person in Singapore who is not an accredited investor, expert investor or an institutional investor (as defined in the Securities Futures Act), StoneX Financial Pte. Ltd. accepts legal responsibility to such persons for the contents of the report only to the extent required by law. Singapore recipients should contact StoneX Financial Pte. Ltd. at 6826 9988 for matters arising from, or in connection with the report.
In the case of all other recipients of this report, to the extent permitted by applicable laws and regulations neither StoneX Financial Pte. Ltd. nor its associated companies will be responsible or liable for any loss or damage incurred arising out of, or in connection with, any use of the information contained in this report and all such liability is hereby expressly disclaimed. No representation or warranty is made, express or implied, that the content of this report is complete or accurate.
StoneX Financial Pte. Ltd. is not under any obligation to update this report.
Trading CFDs carries a high level of risk that may not be suitable for some investors. Consider your investment objectives, level of experience, financial resources, risk appetite and other relevant circumstances carefully. The possibility exists that you could lose some or all of your investments, including your initial deposits. If in doubt, please seek independent expert advice. Visit www.forex.com/en-sg/terms-and-policies for the complete Risk Disclosure Statement.