



Gold Rips at the Open, Pulls Back to Test Swing Zone
Gold has been in a strong trend for the past month following the late-January pullback, and that move hastened at the open this week as war tensions took hold across global markets.
Share this:


Last week’s open saw gold prices run aggressively higher as the ascending triangle gave way, and after an early week pullback to support at prior resistance, bulls went right back at the bid to create another Friday rally that saw prices push up to a fresh high.
This week, gold again jumped at the open and this time there was a very obvious fundamental reason for it, although I’d suggest that this reason had already started to get priced-in given the bullish backdrop in gold that built in the latter half of last week.
In this iteration, gold has run all the way up to the $5400 level, where the move has begun to pause. And this presents a challenging area on the chart to chase the move higher. But, with that being said, given the strength of the breakout there’s the possibility of using short-term momentum to allow for continuation, very similar to what I’ve looked at in webinars for each of the past three weeks.
Last week the support test was at prior resistance of $5100. The week before, it was $4856 and the week before that was the $5k test.
At this point there’s another shorter-term level that’s already in-play at $5325 that I’ll look at in closer detail below.
Gold Four-Hour Chart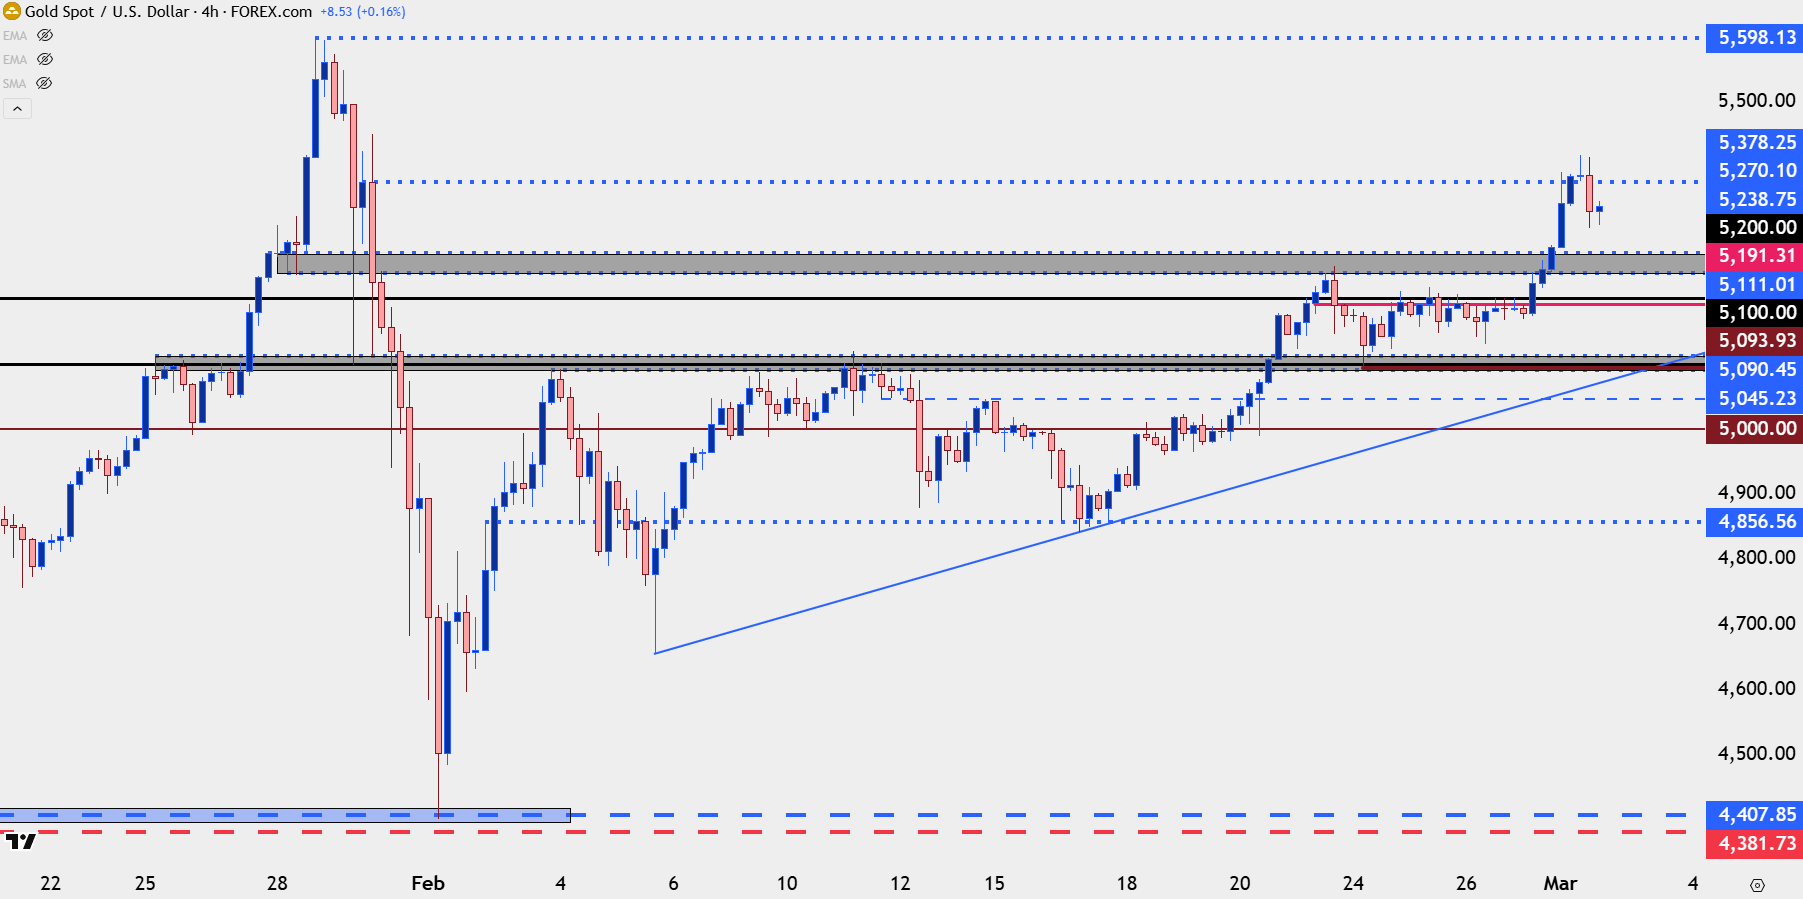
Chart prepared by James Stanley; data derived from Tradingview
Gold Shorter-Term
There hasn’t been much prior history at the current levels in gold and much like trying to find your way through a dark room, grasping on to whatever might be there to retain stability, markets will often grasp on to whatever levels might have some prior relevance.
We’re seeing that at $5325 currently much like we had seen that at $4856 a couple weeks ago.
The more obvious area of emphasis is the prior resistance zone which, again, was a spot of prior price action swings, running between $5238 and $5270. And below that, the zone from $5191-$5200.
This sets up an ‘s1’ an ‘s2’ and an ‘s3’ zone to look for support in order to work with bullish continuation.
As for how to execute – it depends on how aggressive one wants to be. The shorter-term the chart, the higher the probability for noise just given sample sizing. In webinars over the past few weeks I went down to as short as the 30-minute chart, although that can be considered extremely noisy given the small sample sizing.
With that, traders should expect a lower probability of the level holding and, in-turn, a higher potential rate of failure. But, that can be offset with potentially larger reward-to-risk ratios as the shorter-term chart offers the possibility of tighter risk outlays.
Gold Hourly Chart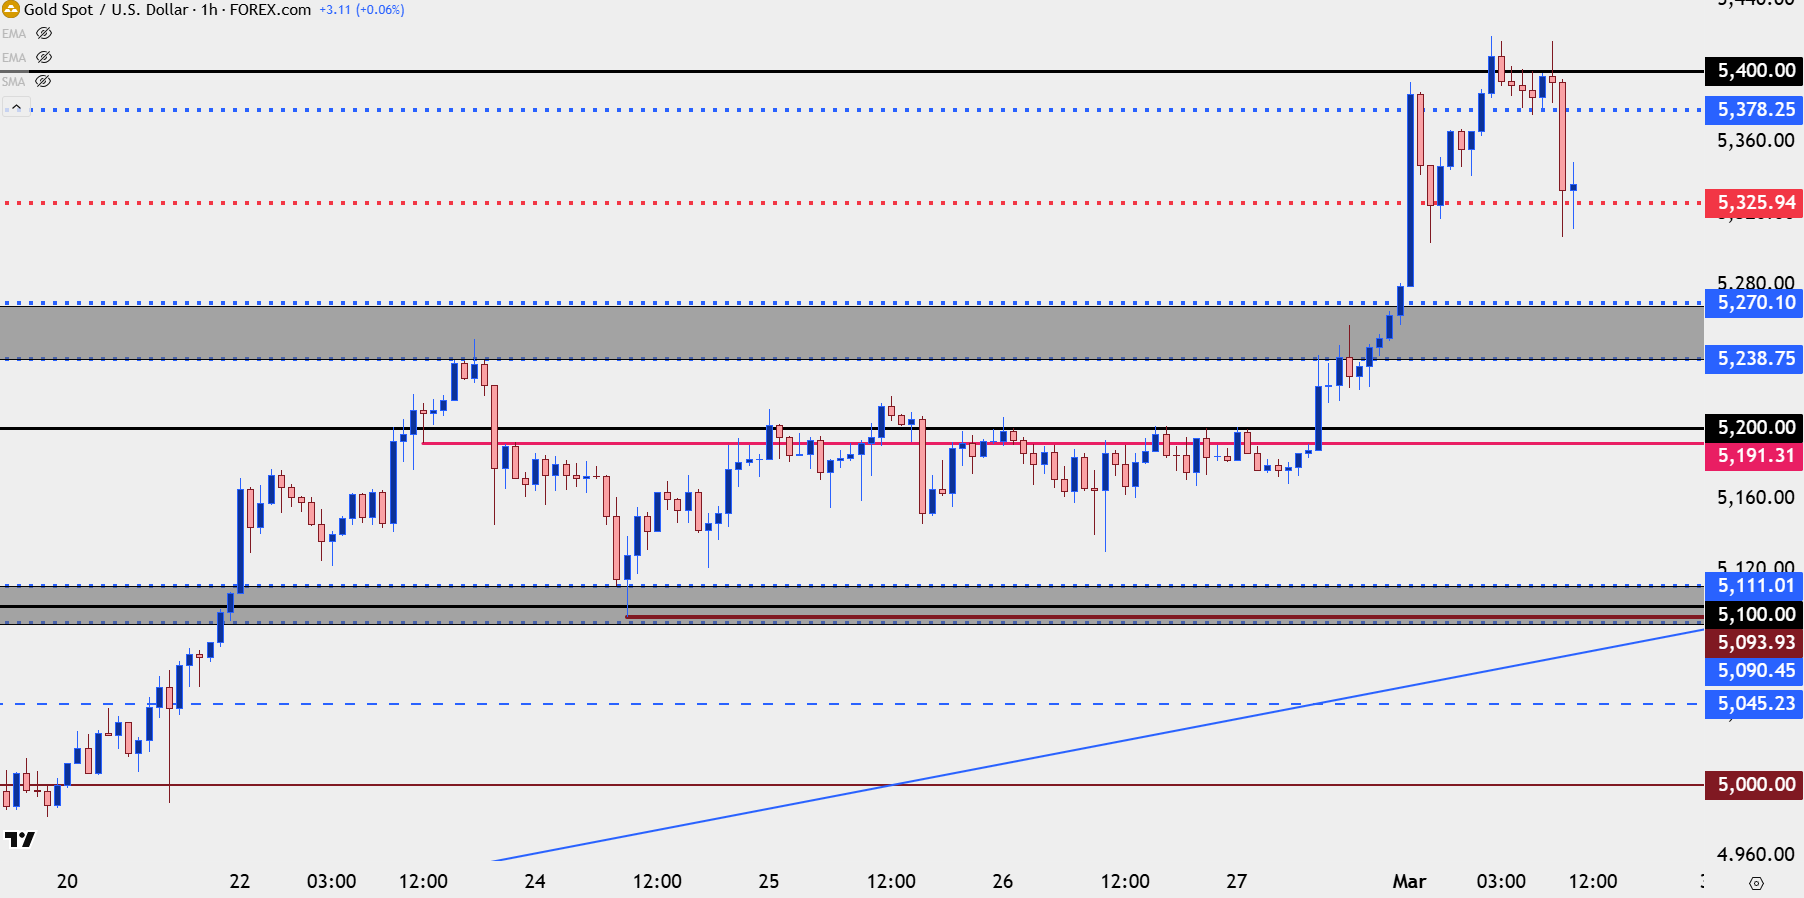
Chart prepared by James Stanley; data derived from Tradingview
Gold Big Picture
The daily chart illustrates the danger of chasing the move at this point as there’s already a wide upper wick on the daily bar. There’s still time before the close of this candle, of course, so that can change, but the fact that the rally has been faded as much as it has already shows how chasing a move can be a dangerous way of working with a trend.
Pullbacks, however, can at the least offer some proximity to support which can allow for risk management.
But, with a trend of this magnitude, I want to continue to bias this as bullish until something obvious changes.
Gold Daily Chart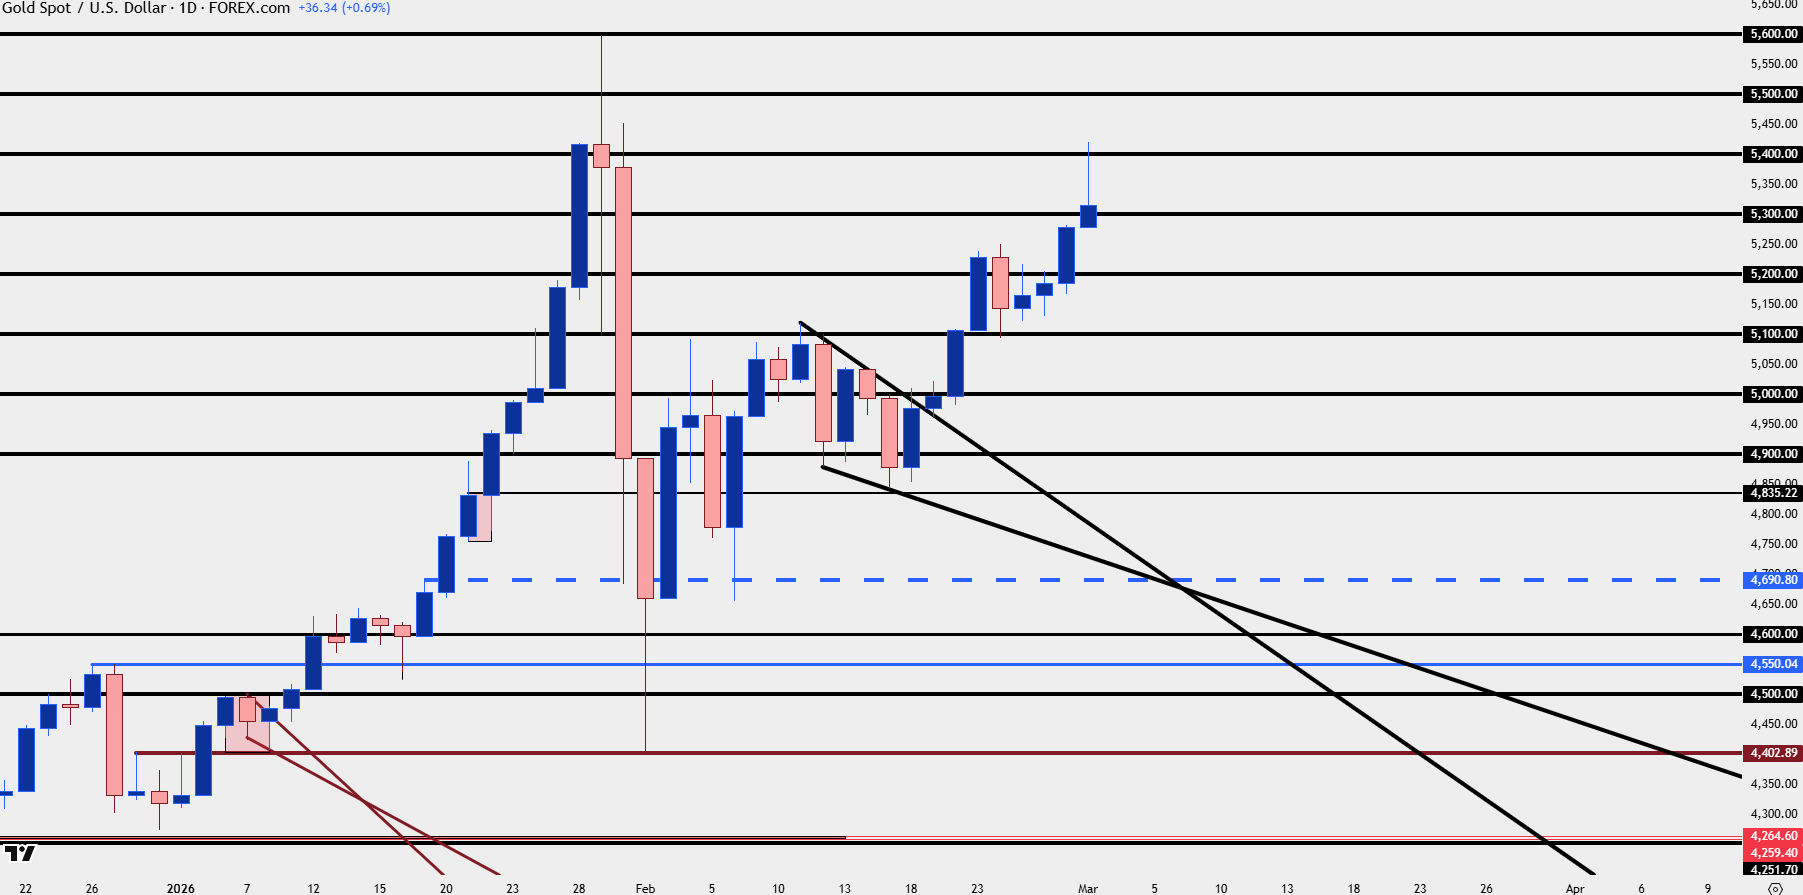
Chart prepared by James Stanley; data derived from Tradingview
--- written by James Stanley, Senior Market Analyst, Global Macro
Related tags:
Latest market news




Open an account in minutes
Experience award-winning platforms with fast and secure execution, and enjoy tight spreads from 0.5 pts on FX and 0.3 pts on indices.
Economic calendar
Web Trader platform
Our sophisticated web-based platform is packed with features.
Related articles

Gold forecast: XAU/USD could take a larger dive after the big rise in yields
Gold prices have been falling in the last few days after last week’s post-FOMC pop faded amid rising interest rate expectations, higher oil prices and a strengthening US dollar. As before, I wasn’t convinced gold would thrive in the current macro backdrop.


Gold, silver slammed as hawkish Fed repricing reignites dollar upside
Gold and silver had held up surprisingly well against surging US yields. Wednesday’s DXY breakout may have changed that equation.


USD/JPY Bulls Continue to Push as Markets ‘Bet Against the House’
USD/JPY is now up by more than 500 pips from the low taken the day that Scott Bessent taunted markets, saying ‘you can bet against me if you want.’
This report is intended for general circulation only. It should not be construed as a recommendation, or an offer (or solicitation of an offer) to buy or sell any financial products. The information provided does not take into account your specific investment objectives, financial situation or particular needs. Before you act on any recommendation that may be contained in this report, independent advice ought to be sought from a financial adviser regarding the suitability of the investment product, taking into account your specific investment objectives, financial situation or particular needs.
StoneX Financial Pte. Ltd., may distribute reports produced by its respective foreign entities or affiliates within the StoneX group of companies or third parties pursuant to an arrangement under Regulation 32C of the Financial Advisers Regulations. Where the report is distributed to a person in Singapore who is not an accredited investor, expert investor or an institutional investor (as defined in the Securities Futures Act), StoneX Financial Pte. Ltd. accepts legal responsibility to such persons for the contents of the report only to the extent required by law. Singapore recipients should contact StoneX Financial Pte. Ltd. at 6826 9988 for matters arising from, or in connection with the report.
In the case of all other recipients of this report, to the extent permitted by applicable laws and regulations neither StoneX Financial Pte. Ltd. nor its associated companies will be responsible or liable for any loss or damage incurred arising out of, or in connection with, any use of the information contained in this report and all such liability is hereby expressly disclaimed. No representation or warranty is made, express or implied, that the content of this report is complete or accurate.
StoneX Financial Pte. Ltd. is not under any obligation to update this report.
Trading CFDs carries a high level of risk that may not be suitable for some investors. Consider your investment objectives, level of experience, financial resources, risk appetite and other relevant circumstances carefully. The possibility exists that you could lose some or all of your investments, including your initial deposits. If in doubt, please seek independent expert advice. Visit www.forex.com/en-sg/terms-and-policies for the complete Risk Disclosure Statement.