







Gold, Silver Correlations Flip as Middle East Tensions Roil Markets
Precious metals have ignored rate expectations and the dollar, instead dancing to crude oil’s tune. That could make the next oil move critical for gold and silver traders.
Share this:
- Gold and silver moved in sync with U.S. yields and the dollar—an unusual shift
- Correlation with WTI crude surged, especially for gold
- Oil chart sits at a key zone that may drive broader market direction
- Gold and silver technical setups suggest downside risks building near-term
Gold, Silver Summary
Gold and silver disconnected from traditional drivers like the U.S. dollar and interest rates as geopolitical tensions in the Middle East evolved, trading with an unusually strong positive correlation to their historical enemies over the past week. Like many other markets during this period, their movements appear to have been heavily influenced by crude oil prices, suggesting developments in that space may be the catalyst for a decisive move in precious metals after a period of relative indecision.
Crude Oil Deemed Geopolitical Risk Barometer
Markets have been fast-moving recently, meaning relationships between individual asset classes can change rapidly in the space of a week. For traders, that can make it difficult to determine what’s noise and what’s signal—especially when established trends are nowhere to be seen.
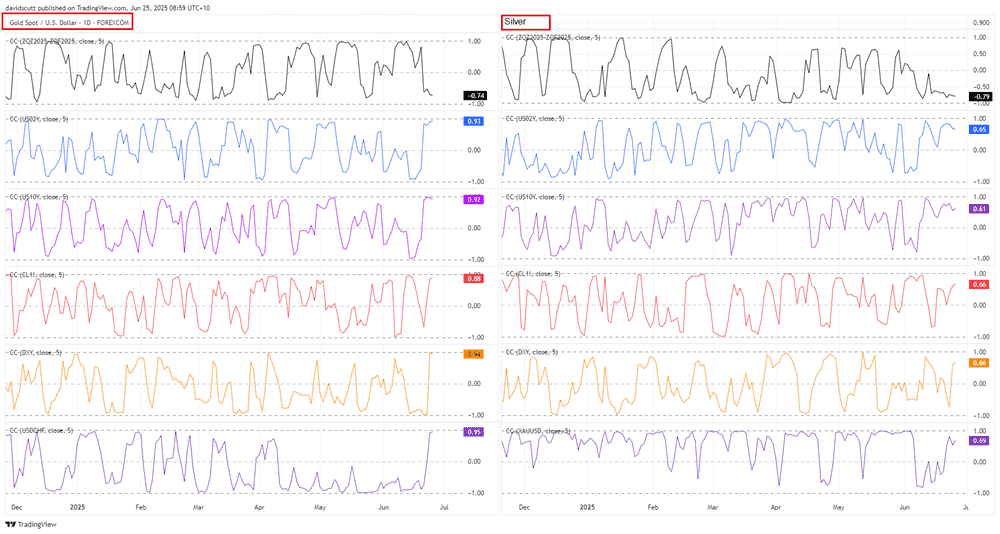
The graph below helps fill in the gaps, although it comes with the caveat that what’s occurred recently may not be instructive over the longer term. It looks at the rolling five-day correlation between gold and silver with a variety of individual markets, covering the period of heightened market volatility driven by the evolving geopolitical situation between Israel, the United States and Iran.
Source: TradingView
Unusually, both metals have been highly correlated with U.S. short and long-dated bond yields (blue, purple lines, respectively) and the U.S. dollar (yellow), behaving in the exact opposite way that historical relationships would suggest. And Fed rate cut pricing for 2025 (black line)? As it’s slowly edged higher, gold and silver have sunk. Again, unusual.
For gold specifically, its previously strong correlation with the Swiss franc has flipped. The tight correlation between gold and silver has also weakened, even though a loose relationship between the two metals remains.
Where some form of logical relationship has emerged is with WTI crude oil futures (red line)—particularly for gold. Over the past week, the correlation coefficient sits at 0.88—strong. For silver, the figure is a softer 0.66, but the relationship is still notable.
What this suggests is that crude is being treated as a gauge of geopolitical risk, helping explain why gold may be moving in near lockstep with it as a known safe haven.
Crude Futures Trade at Key Juncture
This analysis is focused on gold and silver, not crude, but one look at the WTI futures chart shows the price sitting at an important juncture after the recent unwind, holding in a zone between $65.27 on the topside and $64 on the downside. The price has spent a lot of time on either side of this zone over the past year, hinting that what happens next may be important not only for crude traders but also for broader markets, including gold and silver.

Source: TradingView
Given recent price action, the surge in volumes, and the abrupt shift in momentum from outright bullish to neutral-bearish, downside risks are evident unless we see another threat to the supply side. If the price were to break and close beneath both $64 support and the 50-day moving average, it would increase the risk of a move towards support at $60 and $57.70.
If the price holds within or above the support zone, $68.36 is the topside level of note, coinciding with horizontal resistance, with the 200-day moving average located just above.
Gold Pressured as Risk Appetite Recovers
Source: TradingView
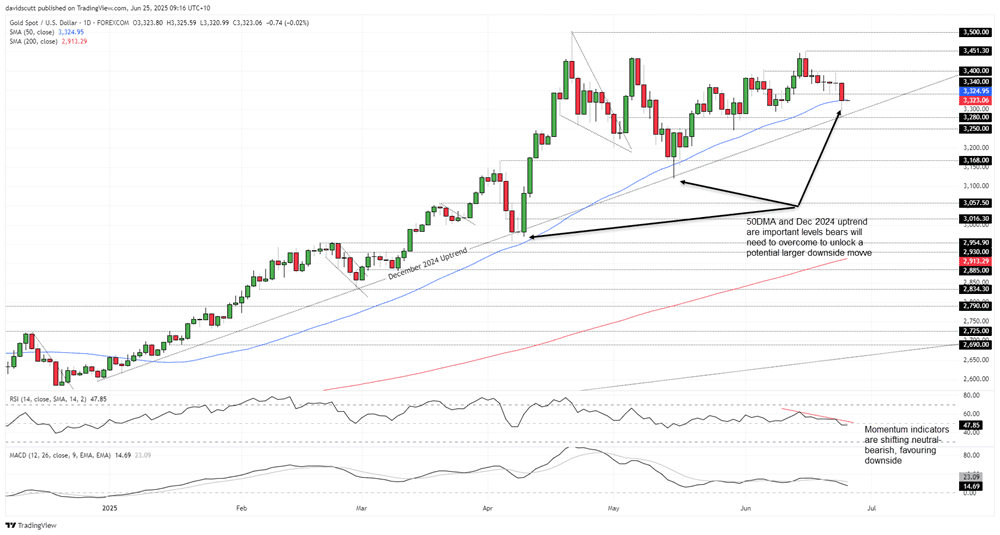
Like WTI crude, downside risks look greater than upside for gold near-term, although price action around the 50-day moving average is an important hurdle that bears will need to overcome.
On Tuesday, gold traded through the 50-day moving average but managed to claw back above it into the close, mirroring the price action seen in May. However, with RSI (14) now in a clear downtrend and beneath 50, momentum is shifting lower. MACD has also crossed the signal line—although with the crossover occurring above zero, the message is more neutral than bearish for now.
If downside risks materialise and the 50-day is broken cleanly, it would put a retest of the December 2024 uptrend and horizontal support at $3280 on the radar. A break and close beneath the intersection of these two levels may encourage others to join in the bearish unwind, leaving $3250 and $3168 as the next logical downside targets.
If gold manages to hold above the 50-day moving average, $3340 and $3400 are the first topside levels of note. While gold has defied the bears for lengthy periods in recent years, it was telling how poorly it traded over the past week in an environment where it would normally shine. That’s something to keep in mind if we do see another bounce.
Silver’s Bearish Break Stalls

Source: TradingView
Silver sits in a similar position to gold on the daily chart, remaining in a broader uptrend despite pulling back from multi-decade highs hit earlier in the month. The bearish break of the rising wedge flagged last week played out nicely at first, although bears have continued to be thwarted by bulls lurking beneath $35.50 ever since—including on Tuesday.
While the strong bounces from beneath $35.50 suggest downside may be hard-won near term, with momentum indicators starting to skew neutral, it suggests bears may slowly be gaining the upper hand, putting a potential retest of uptrend support running from the April lows on the cards should buyers beneath $35.50 eventually be overrun.
$34.87 is an important level beneath the uptrend, coinciding with the former market peak hit in October 2024. If that were to give way, $34, the 50-day moving average, and support at $33.69 are the levels to focus on when assessing potential setups.
If buyers beneath $35.50 continue to emerge, $36.50 and the February 2012 high of $37.46 screen as targets for bullish setups.
Related tags:

Open an account in minutes
Experience award-winning platforms with fast and secure execution, and enjoy tight spreads from 0.5 pts on FX and 0.3 pts on indices.
Economic calendar
Web Trader platform
Our sophisticated web-based platform is packed with features.
Related articles

Gold forecast: XAU/USD could take a larger dive after the big rise in yields
Gold prices have been falling in the last few days after last week’s post-FOMC pop faded amid rising interest rate expectations, higher oil prices and a strengthening US dollar. As before, I wasn’t convinced gold would thrive in the current macro backdrop.


WTI Crude Oil Mulls Bounce from $90
Having fallen 17% from its cycle highs in just five days and now holding above $90, perhaps it could be time for crude oil to bounce over the near term.


Gold, silver slammed as hawkish Fed repricing reignites dollar upside
Gold and silver had held up surprisingly well against surging US yields. Wednesday’s DXY breakout may have changed that equation.
This report is intended for general circulation only. It should not be construed as a recommendation, or an offer (or solicitation of an offer) to buy or sell any financial products. The information provided does not take into account your specific investment objectives, financial situation or particular needs. Before you act on any recommendation that may be contained in this report, independent advice ought to be sought from a financial adviser regarding the suitability of the investment product, taking into account your specific investment objectives, financial situation or particular needs.
StoneX Financial Pte. Ltd., may distribute reports produced by its respective foreign entities or affiliates within the StoneX group of companies or third parties pursuant to an arrangement under Regulation 32C of the Financial Advisers Regulations. Where the report is distributed to a person in Singapore who is not an accredited investor, expert investor or an institutional investor (as defined in the Securities Futures Act), StoneX Financial Pte. Ltd. accepts legal responsibility to such persons for the contents of the report only to the extent required by law. Singapore recipients should contact StoneX Financial Pte. Ltd. at 6826 9988 for matters arising from, or in connection with the report.
In the case of all other recipients of this report, to the extent permitted by applicable laws and regulations neither StoneX Financial Pte. Ltd. nor its associated companies will be responsible or liable for any loss or damage incurred arising out of, or in connection with, any use of the information contained in this report and all such liability is hereby expressly disclaimed. No representation or warranty is made, express or implied, that the content of this report is complete or accurate.
StoneX Financial Pte. Ltd. is not under any obligation to update this report.
Trading CFDs carries a high level of risk that may not be suitable for some investors. Consider your investment objectives, level of experience, financial resources, risk appetite and other relevant circumstances carefully. The possibility exists that you could lose some or all of your investments, including your initial deposits. If in doubt, please seek independent expert advice. Visit www.forex.com/en-sg/terms-and-policies for the complete Risk Disclosure Statement.