



Gold, Silver Outlook: Short-Term Recovery?
Gold, Silver Outlook: Precious metals have cooled following improved trade sentiment and a firmer U.S. dollar. While bullish recoveries are in play, the market continues to test the sustainability of the recent historic drop. Risks of another leg lower in gold and silver remain present.
Share this:

Key Events
- Investors are balancing profit-taking against ongoing safe-haven demand, keeping gold near the $4,000 mark and silver around $49.
- The DXY’s hawkish tone following the FOMC meeting, alongside progress in U.S.–China trade talks, maintains downside pressure on metals.
Although both gold and silver fell sharply from their 2025 highs, they remain significantly higher year to date—up roughly 69% for silver and 52% for gold.
This keeps the safe-haven demand narrative intact, as investors weigh profit-taking opportunities while cautiously watching for renewed gains toward the $5,000 level.
Still, another steep correction before realigning toward that long-term target remains a valid risk, particularly amid easing trade tensions and the dollar’s hawkish hold.
The Fed’s rate cuts appear largely priced in on the DXY chart, which continues to hold above the 96 support—a 17-year trendline—supporting the dollar’s bullish bias through late 2025.
If precious metals begin to track the dollar’s movements upward again, uncertainty could be resurfacing. Meanwhile, the U.S. government shutdown remains a persistent shadow over the broader market outlook.
While a long-term uptrend scenario remains possible, both market headlines and technical structures currently point to the potential for further near-term weakness before the next sustained rebound.
Technical Analysis: Quantifying Uncertainties
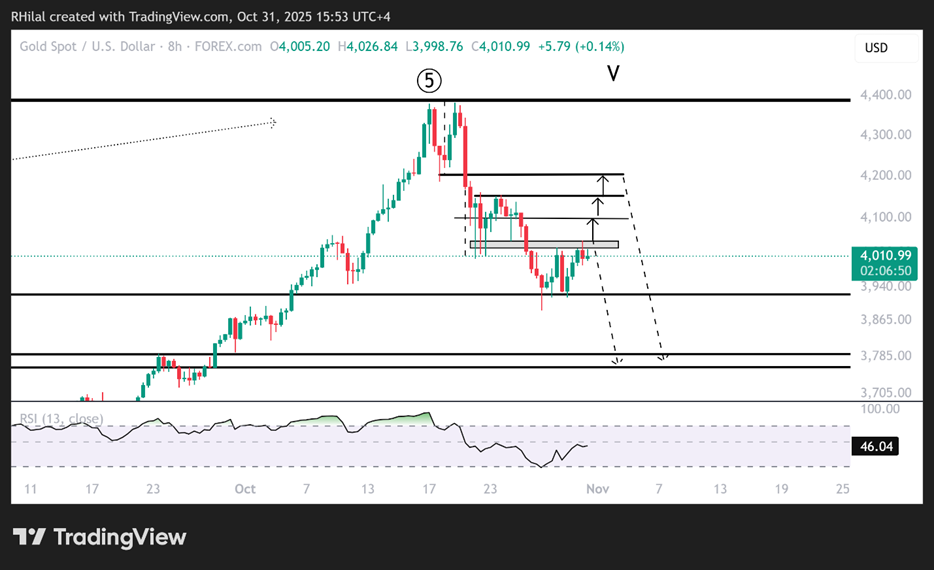
Gold Outlook: 8-Hour Time Frame – Log Scale
Source: Trading view
The 8-hour chart is used here to minimize short-term noise and highlight smoother patterns drawn from daily trends.
Gold prices are consolidating between $3,900 and $4,040, balancing between buying interest and residual selling pressure. A confirmed break below $3,900 could trigger a deeper decline toward $3,790 and $3,760, with a potential reversal zone emerging afterward. In extreme scenarios, a sustained move below $3,690 could extend losses toward $3,500, the major resistance-turned-support area from 2025.
From the upside, a confirmed close above $4,040 could extend gains toward $4,100, $4,150, and $4,200 before another potential retracement. If these levels hold, the long-term path toward $5,000 may resume.
Gold Outlook: Monthly Time Frame – Log Scale
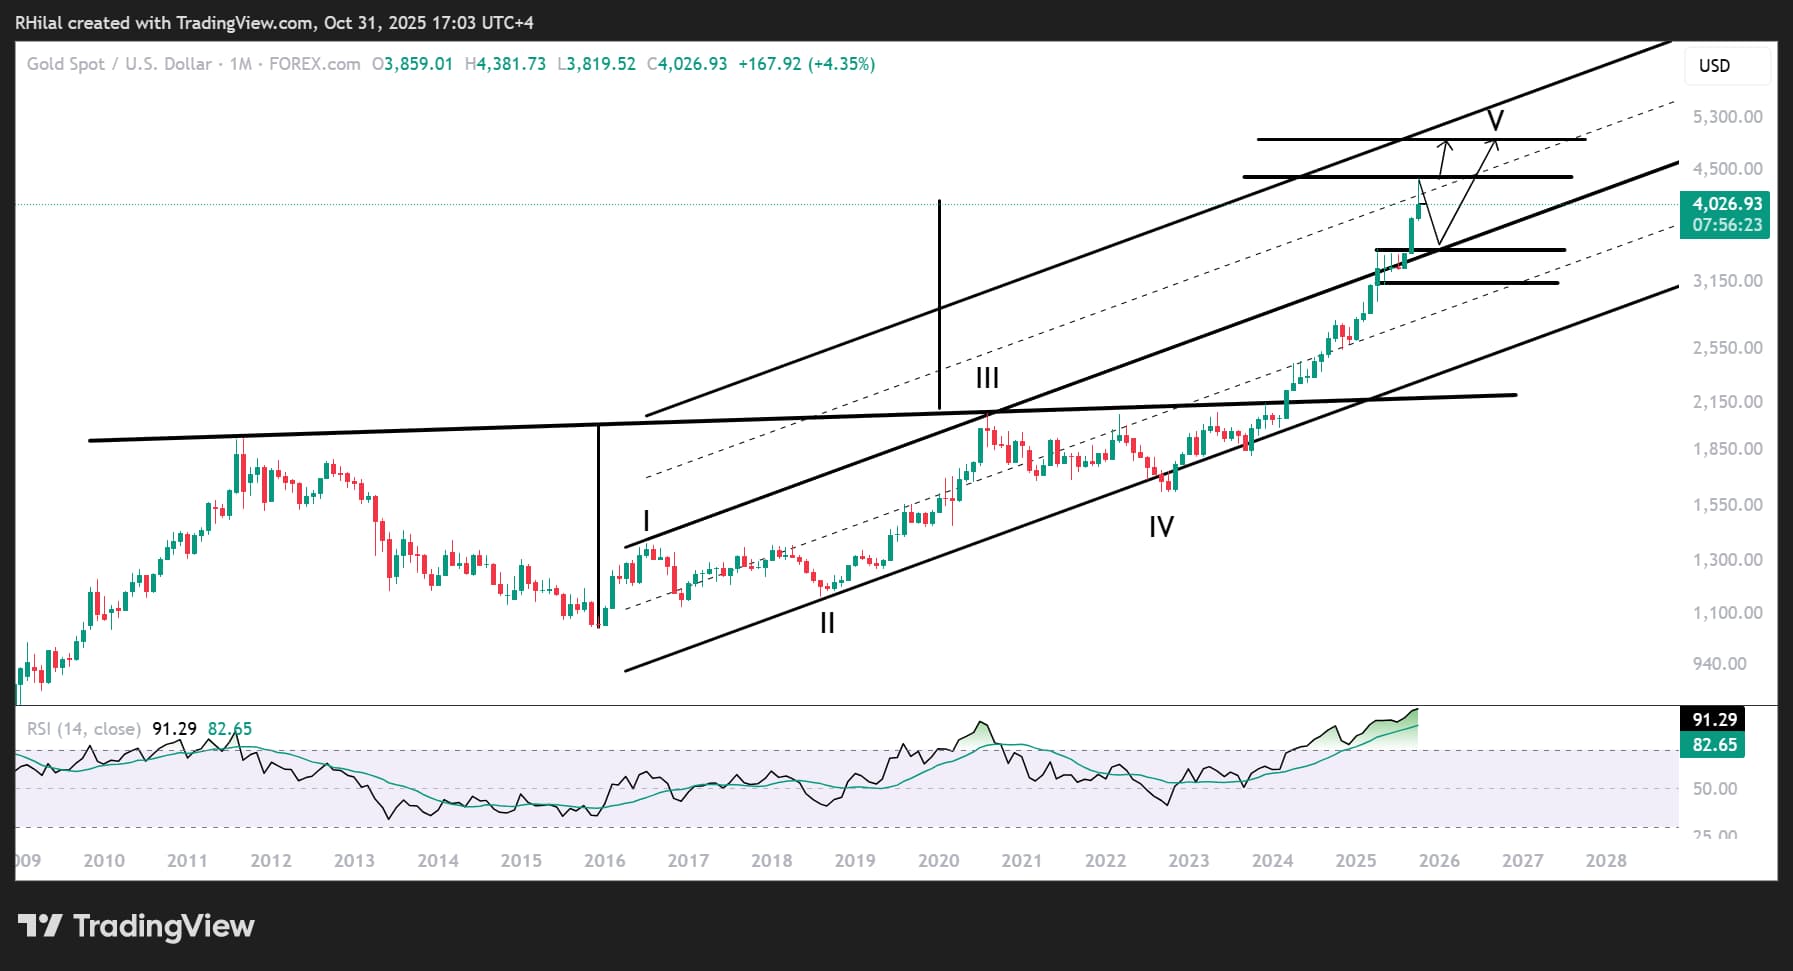
From a monthly perspective, gold has slipped below the mid-zone of a duplicated ascending channel that has been respected since 2016. Given the structure and current overbought momentum, a drop toward $3,500 — aligning with the upper boundary of the nine-year channel — remains possible before the uptrend resumes toward the $5,000 target, especially if the $3,700–$3,690 support zone fails to hold.
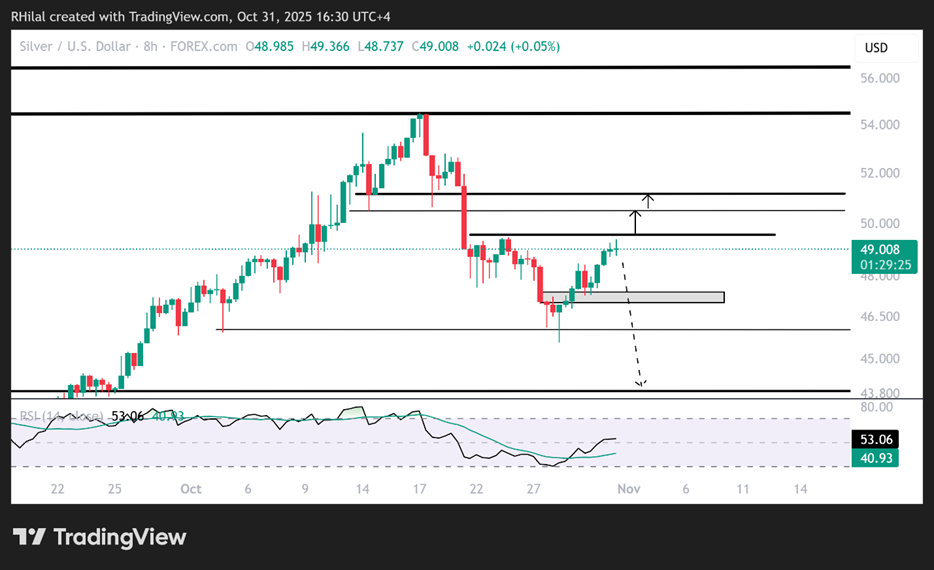
Silver Outlook: 8-Hour Time Frame – Log Scale
Source: Trading view
An 8-hour chart is also used for silver to reduce short-term volatility and define smoother directional trends.
Although the RSI has rebounded from oversold territory and climbed above its mid-range, downside risks remain if prices fall back below $47.
Such a move could extend declines toward $44 and $42, which could later form a potential rebound base.
On the other hand, a confirmed close above $49.60 would likely extend the rebound toward $50.50 and $51.20, before either another short-term correction or a continuation toward the $60 level — the next major technical target.
Silver Outlook: Weekly Time Frame – Log Scale

On the weekly-to-monthly scale, silver’s chart mirrors gold’s pattern — showing a breakout beyond a long-term channel followed by a pullback from the mid-zone of a duplicated pattern, now eyeing the upper boundary of the original channel.
The supports between $44 and $42 align with the upper boundary of a rising channel that has been respected since 2023, connecting a series of higher highs between 2023 and 2024.
This forms a potential support area for any near-term price declines, especially as the market continues to struggle with overbought momentum on higher time frames.
If this structure holds, silver could later resume its broader upward trajectory toward the $60 level, the upper boundary of the duplicated channel.
Written by Razan Hilal, CMT
Follow on X: @Rh_waves
Related tags:
Latest market news




Open an account in minutes
Experience award-winning platforms with fast and secure execution, and enjoy tight spreads from 0.5 pts on FX and 0.3 pts on indices.
Economic calendar
Web Trader platform
Our sophisticated web-based platform is packed with features.
Related articles
EUR/USD Q4 2026 Outlook: Euro at a Crossroads as Fed, ECB Tighten 9 25 2026
EUR/USD enters Q4 at a pivotal inflection point as competing Fed-ECB policy paths and persistent inflation risks collide with major technical support.
USD/JPY Q4 2026 Outlook: Hawkish Fed Pricing Clashes With Intervention Risk
The year-end tug-of-war is clear: hawkish Fed pricing supports USD/JPY, while intervention risk limits the upside.


Japanese Yen Forecast: USD/JPY 4% Rally Challenges Post-Intervention Downtrend 9 24 2026
USD/JPY momentum has shifted sharply higher, putting a major resistance confluence in focus as U.S. and Japanese event risk builds.
This report is intended for general circulation only. It should not be construed as a recommendation, or an offer (or solicitation of an offer) to buy or sell any financial products. The information provided does not take into account your specific investment objectives, financial situation or particular needs. Before you act on any recommendation that may be contained in this report, independent advice ought to be sought from a financial adviser regarding the suitability of the investment product, taking into account your specific investment objectives, financial situation or particular needs.
StoneX Financial Pte. Ltd., may distribute reports produced by its respective foreign entities or affiliates within the StoneX group of companies or third parties pursuant to an arrangement under Regulation 32C of the Financial Advisers Regulations. Where the report is distributed to a person in Singapore who is not an accredited investor, expert investor or an institutional investor (as defined in the Securities Futures Act), StoneX Financial Pte. Ltd. accepts legal responsibility to such persons for the contents of the report only to the extent required by law. Singapore recipients should contact StoneX Financial Pte. Ltd. at 6826 9988 for matters arising from, or in connection with the report.
In the case of all other recipients of this report, to the extent permitted by applicable laws and regulations neither StoneX Financial Pte. Ltd. nor its associated companies will be responsible or liable for any loss or damage incurred arising out of, or in connection with, any use of the information contained in this report and all such liability is hereby expressly disclaimed. No representation or warranty is made, express or implied, that the content of this report is complete or accurate.
StoneX Financial Pte. Ltd. is not under any obligation to update this report.
Trading CFDs carries a high level of risk that may not be suitable for some investors. Consider your investment objectives, level of experience, financial resources, risk appetite and other relevant circumstances carefully. The possibility exists that you could lose some or all of your investments, including your initial deposits. If in doubt, please seek independent expert advice. Visit www.forex.com/en-sg/terms-and-policies for the complete Risk Disclosure Statement.