



Gold, silver track dollar moves at historical extremes
Gold and silver remain unusually sensitive to US dollar direction, with US inflation data and elevated risk of disorderly carry trade unwinds in focus for traders over the remainder of the week.
Share this:

- Gold, silver correlations with dollar near historical extremes
- DXY sits just above an important support zone
- US inflation next key risk event for markets
- Disorderly yen carry trade unwind remains a left-tail risk
Gold and silver have essentially become a play on directional movements in the US dollar over the past month, and especially the past fortnight, with the strength of the inverse relationship pushing towards historical extremes.
Dollar relationship moves into rare territory
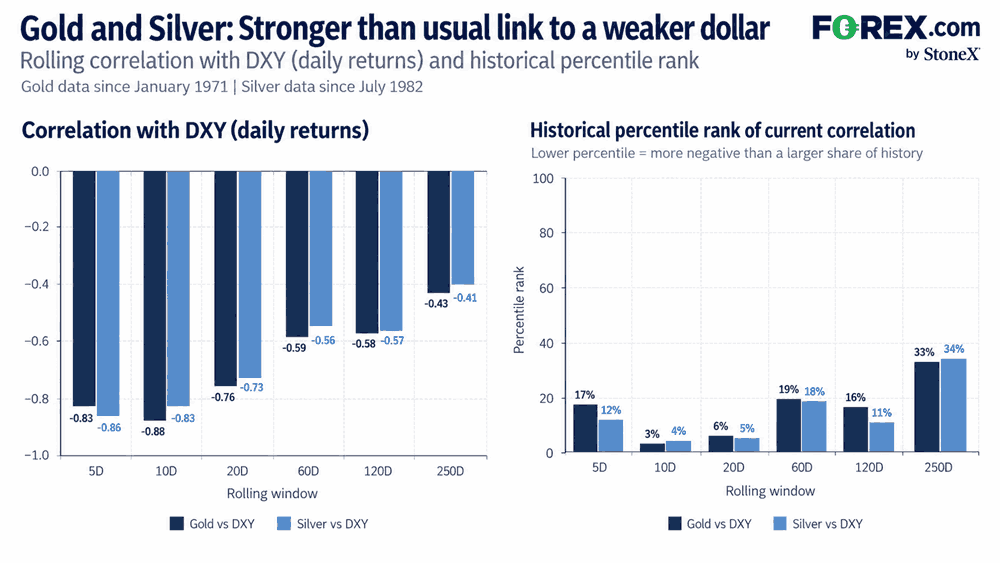
While the inverse relationship between gold, silver and other precious metals with the US dollar has been evident for decades, the strength of the relationship is unusually high right now.
Source: LSEG
Over the past 10 trading days, gold’s correlation with DXY has fallen to around -0.88, while silver’s stands at -0.83. Those readings sit around the 3rd percentile for gold and 4th percentile for silver relative to their respective histories, meaning the inverse relationship has only been stronger during a very small proportion of comparable windows.
The 20-day relationship is also tight, with gold at around -0.76 and silver at -0.73, ranking near the 6th and 5th percentiles respectively.
With the DXY just above an important support level, should that extreme relationship be maintained, a downside break in the DXY points to the increased risk of renewed upside across the precious metals complex.
Yen strength adds pressure to the dollar
Source: Tradingview
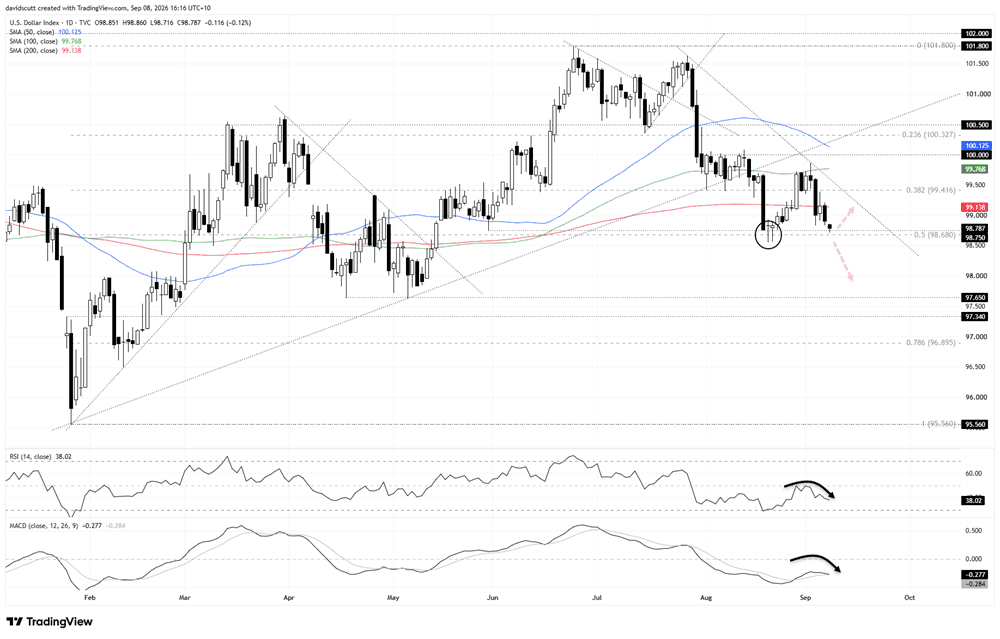
DXY finds itself struggling beneath the 200-day moving average, having slid back beneath it late last week, and is now perched above a support zone comprising the May 29 low of 98.75, along with the 50% retracement of the 2026 low-high at 98.68.
There were two unsuccessful probes beneath the zone back in August, but with the oscillators rolling over, indicating downside momentum is building again, the risk of a downside break appears to be growing, especially with the Japanese yen continuing to strengthen on Tuesday, seeing USD/JPY hit levels not seen since February.
Should the unwind be sustained, it would only add to downside risk for the broader DXY index, especially should the euro join the move.
Gold wedged between key levels
Source: Tradingview
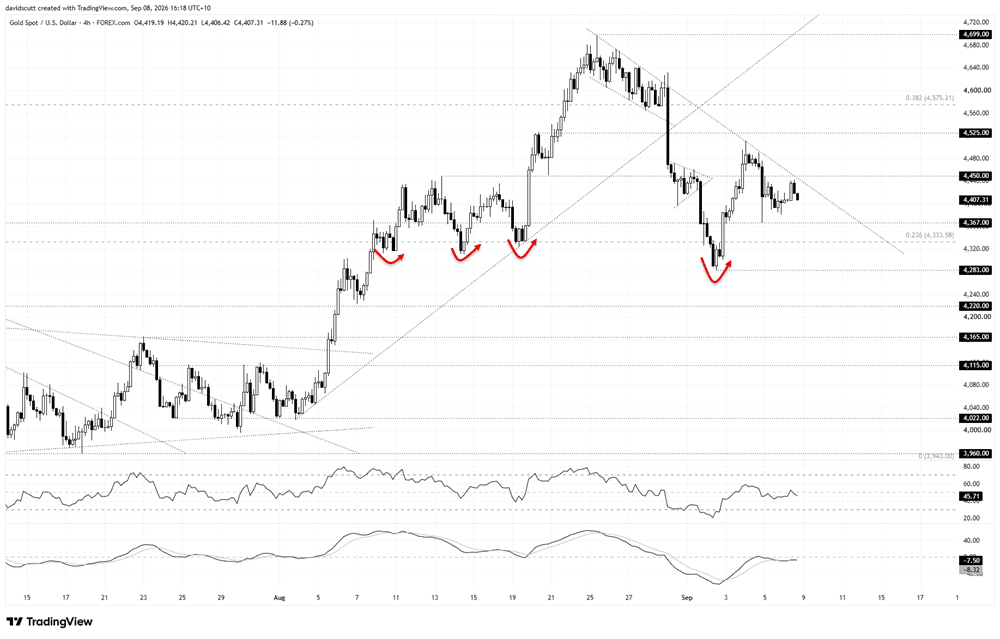
Early gains in Asia have reversed in the latter parts of the session, with the push higher stalling just beneath the confluence of the August downtrend and horizontal resistance at $4,450 an ounce. Those levels are the immediate focal point overhead.
Underneath where the price now trades, $4,367 is the first level on the radar given it acted as support and resistance on multiple occasions going back to the early parts of this year. Further below, the 23.6% Fib retracement of the January to June low-high is located at $4,333 an ounce. Dips beneath that level, down to the early September low of $4,283, have made for good buying over recent months.
The message from the oscillators is one of neutrality. RSI (14) sits just beneath the 50 while MACD is running parallel to the signal line, sitting just in negative territory.
With the technical picture for gold offering little from a directional breakout perspective, dollar performance around the US inflation data on Thursday and Friday may be influential in determining which direction the price shifts next.
Silver triangle points to breakout risk
Source: Tradingview
Like gold, silver has staged a sizable reversal late in the Asian session, mirroring similar price action in Asian tech stocks that opened strongly before gains were slowly whittled away.
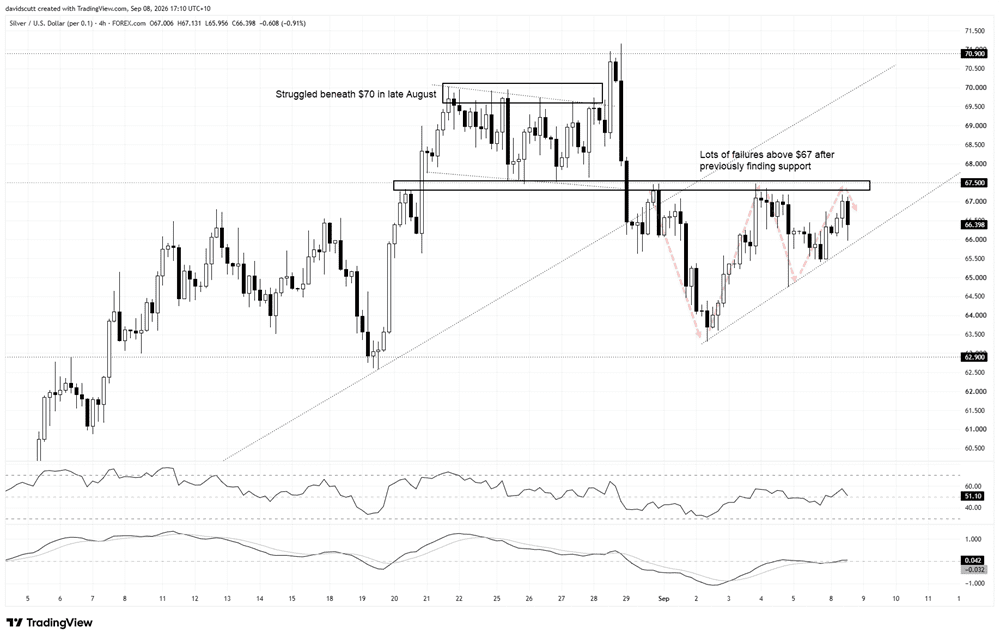
From a technical perspective, the price on the four-hourly continues to coil in an ascending triangle, with moves above $67 towards $67.50 resistance capping gains for the moment, while dips towards the uptrend established in early September continue to attract buying.
While ascending triangles are often associated with bullish breakouts, I would not be rushing to establish longs without a clear and sustained push above $67.50, given the iffy price beneath it recently.
The cautious view is only strengthened by the risk of forced yen carry trade unwinds, some of which have likely found their way into the precious metals space, creating the risk of disorderly downside moves across the precious metals complex. Whichever direction the price breaks from the structure may be informative as to where directional risks lie over the medium term.
Overhead, silver struggled underneath $70 in late August, and while there was one bullish breakout that eventually occurred, it stalled at $70.90, a level that acted as support and resistance on multiple occasions going back to late April.
On the downside, $65.50, the September 4 low of $64.75, and $63.30 are the focal points before $62.90 comes into view, another support and resistance level going back to earlier this year.
The message from the oscillators is neutral with RSI (14) sitting at 48 while MACD is flatlining above the signal line, holding just in positive territory. Focus should therefore be on price rather than adoption of a specific directional bias, with DXY gyrations another useful input when assessing potential setups.
Latest market news




Open an account in minutes
Experience award-winning platforms with fast and secure execution, and enjoy tight spreads from 0.5 pts on FX and 0.3 pts on indices.
Economic calendar
Web Trader platform
Our sophisticated web-based platform is packed with features.
Related articles
Gold Q4 2026 outlook: Resilience in the face of rallying dollar and yields
As we headed towards the latter stages of Q3 and into Q4, the Fed had just hiked rates in a hawkish FOMC meeting, while the likes of the ECB and BoJ had also tightened their respective policies. Oil prices remained elevated amid the prolonged US-Iran conflict. Meanwhile, bond yields were breaking out, and the dollar was higher across the board. Yet, remarkably, gold was still holding in the positive territory for the third quarter, even if it had weakened somewhat in September.
EUR/USD Q4 2026 Outlook: Euro at a Crossroads as Fed, ECB Tighten 9 25 2026
EUR/USD enters Q4 at a pivotal inflection point as competing Fed-ECB policy paths and persistent inflation risks collide with major technical support.

AUD/USD Q4 Outlook: RBA and Fed Hikes Set the Tone
AUD/USD enters Q4 with RBA and Fed hikes in focus as sticky inflation, rising unemployment and US dollar strength shape the Australian dollar.

This report is intended for general circulation only. It should not be construed as a recommendation, or an offer (or solicitation of an offer) to buy or sell any financial products. The information provided does not take into account your specific investment objectives, financial situation or particular needs. Before you act on any recommendation that may be contained in this report, independent advice ought to be sought from a financial adviser regarding the suitability of the investment product, taking into account your specific investment objectives, financial situation or particular needs.
StoneX Financial Pte. Ltd., may distribute reports produced by its respective foreign entities or affiliates within the StoneX group of companies or third parties pursuant to an arrangement under Regulation 32C of the Financial Advisers Regulations. Where the report is distributed to a person in Singapore who is not an accredited investor, expert investor or an institutional investor (as defined in the Securities Futures Act), StoneX Financial Pte. Ltd. accepts legal responsibility to such persons for the contents of the report only to the extent required by law. Singapore recipients should contact StoneX Financial Pte. Ltd. at 6826 9988 for matters arising from, or in connection with the report.
In the case of all other recipients of this report, to the extent permitted by applicable laws and regulations neither StoneX Financial Pte. Ltd. nor its associated companies will be responsible or liable for any loss or damage incurred arising out of, or in connection with, any use of the information contained in this report and all such liability is hereby expressly disclaimed. No representation or warranty is made, express or implied, that the content of this report is complete or accurate.
StoneX Financial Pte. Ltd. is not under any obligation to update this report.
Trading CFDs carries a high level of risk that may not be suitable for some investors. Consider your investment objectives, level of experience, financial resources, risk appetite and other relevant circumstances carefully. The possibility exists that you could lose some or all of your investments, including your initial deposits. If in doubt, please seek independent expert advice. Visit www.forex.com/en-sg/terms-and-policies for the complete Risk Disclosure Statement.