




Gold, USD/JPY analysis: Dollar in focus as CPI looms
Gold analysis: in this article I have discussed how to trade the metal around CPI release. USD/JPY analysis is also discussed, with technical levels to watch. Meanwhile CPI is seen rising to 3.2% from 3.1%.
Share this:

- Gold analysis: how to trade the metal around CPI release
- USD/JPY analysis: technical levels to watch
- CPI seen rising to 3.2% from 3.1%
The imminent release of the US inflation report at 13:30 GMT has captured everyone's focus, holding the potential to inject much-needed volatility into the FX markets, which have been relatively calm throughout the week thus far. Major currency pairs are gearing up for potentially significant moves, but don’t forget about gold and silver, with the buck-denominated assets also likely to move sharply on the back of the CPI data.
What to expect from CPI data
Analysts anticipate that the US CPI data will indicate an increase in inflation, reaching an annual rate of 3.2% in December on a headline basis, as opposed to the 3.1% recorded in November. On a monthly basis, it is expected that the CPI will show a 0.2% uptick, following a 0.1% rise in the previous month. The core reading, excluding food and energy, is projected to be 3.8% year-on-year or 0.3% month-on-month.
Gold analysis: how to trade the metal around CPI release
So how do we trade the CPI report? There are obviously many ways but for most traders waiting for the actual data makes more sense than trying to pre-empt it. More often than not, the initial data-driven move does retrace before resuming in the direction of the surprise – and sometimes even completely reverses. What’s more, an in-line reading could weigh on the dollar given that the market is potentially positioned for a strong report, with the dollar rising last week. So, if you are a more conservative-type trader, t is best to wait until after the data is released, see how gold has reacted and then potentially trade accordingly.
You can obviously trade gold in either direction, but sometimes it is a better idea to have two contrasting trades in mind and trade one or the other market depending on the outcome of the data. With that in mind, the JPY has been among the weakest performers this week after Tokyo CPI came in slightly below forecasts and wage growth contracted sharply, suggesting that the BoJ will potentially delay its policy normalisation process. This makes the USD/JPY a long candidate if the CPI turns out to be stronger. However, if the data disappoints or the US dollar otherwise reacts negatively to the inflation report, then looking for long gold setup may make more sense.
Gold technical analysis
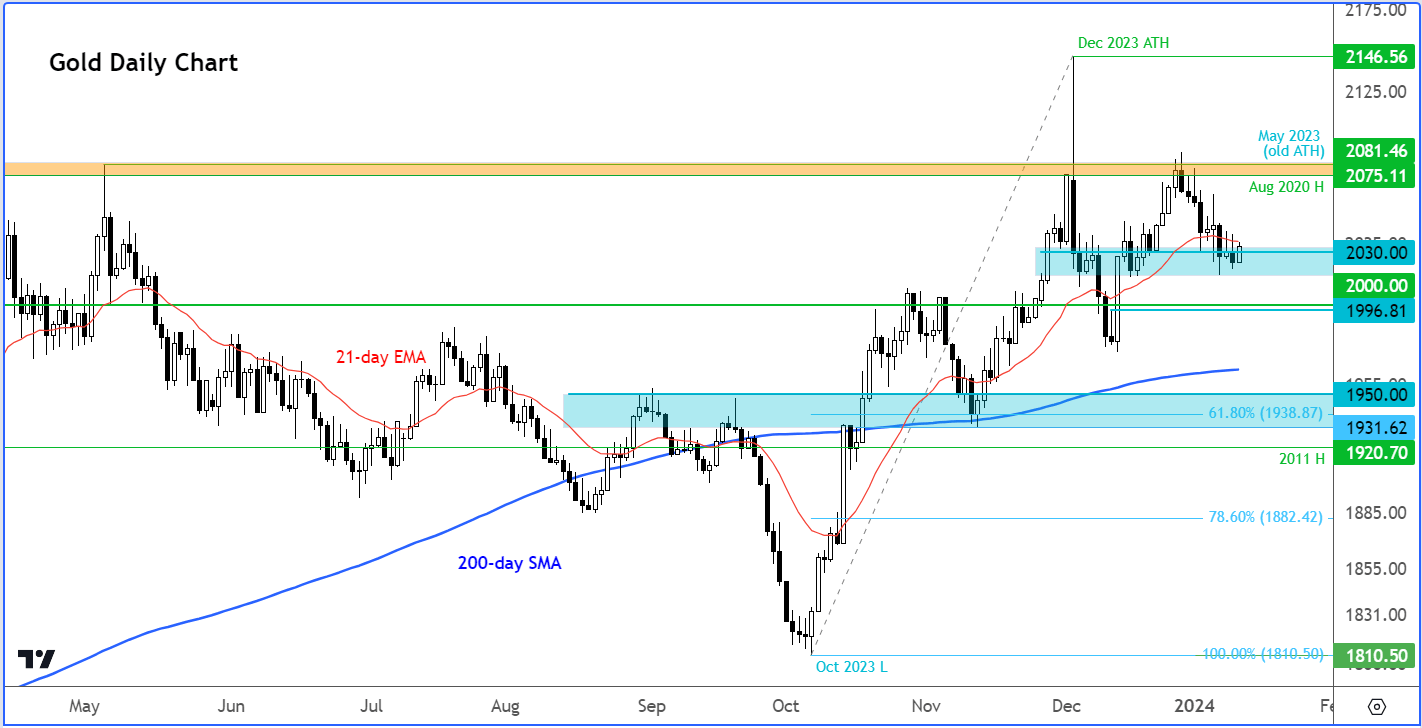
All week, gold has been trying to find support from around $2030 but so far there has been no decisive move from around this level. After today’s CPI data is out of the way, bullish traders will want to see evidence and a clear bullish signal to confirm that the metal has formed a low. If that is the case, then we could see the onset of a rally towards $2075, the high from August 2020, which is going to remain a pivotal zone for gold. The metal has not been able to post a weekly close above this level. If and when it does, then the December 2023 high of $2146 will come into focus next.
However, if support around $2030 breaks decisively then the next key level to watch is around $2000, the psychologically-important level, followed by $1950, which roughly corresponds with the 200-day average and prior support.
USD/JPY analysis: technical levels to watch
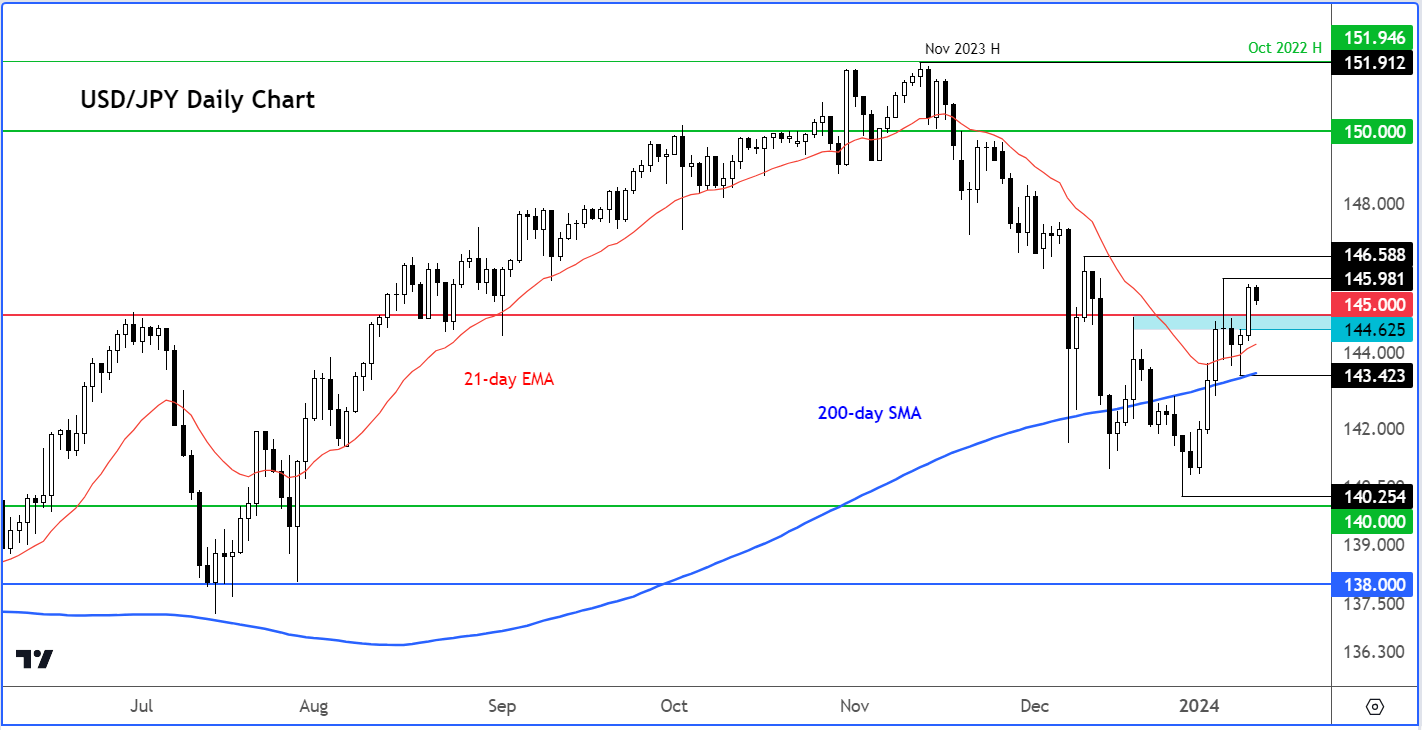
The USDJPY was a touch weaker ahead of the CPI data, but it has been trending higher in recent days. The key levels of support to watch include 145.00, a psychologically significant level, followed by 144.62, corresponding to the head of the hammer candle observed on Tuesday. Below these levels, we have the 200-day average around 143.40 – a shift to a bearish bias is likely if this level is decisively breached.
On the upside, the first level to watch is around 146.00, roughly corresponding to last week’s high (145.98). Above this level we have 146.60, representing the pre-FOMC high established on December 11.
Source for all charts used in this article: TradingView.com
-- Written by Fawad Razaqzada, Market Analyst
Follow Fawad on Twitter @Trader_F_R
How to trade with City Index
You can trade with City Index by following these four easy steps:
- Open an account, or log in if you’re already a customer
• Open an account in the UK
• Open an account in Australia
• Open an account in Singapore
- Search for the company you want to trade in our award-winning platform
- Choose your position and size, and your stop and limit levels
- Place the trade
Related tags:
Latest market news




Open an account in minutes
Experience award-winning platforms with fast and secure execution, and enjoy tight spreads from 0.5 pts on FX and 0.3 pts on indices.
Economic calendar
Web Trader platform
Our sophisticated web-based platform is packed with features.
Related articles
Gold Q4 2026 outlook: Resilience in the face of rallying dollar and yields
As we headed towards the latter stages of Q3 and into Q4, the Fed had just hiked rates in a hawkish FOMC meeting, while the likes of the ECB and BoJ had also tightened their respective policies. Oil prices remained elevated amid the prolonged US-Iran conflict. Meanwhile, bond yields were breaking out, and the dollar was higher across the board. Yet, remarkably, gold was still holding in the positive territory for the third quarter, even if it had weakened somewhat in September.
EUR/USD Q4 2026 Outlook: Euro at a Crossroads as Fed, ECB Tighten 9 25 2026
EUR/USD enters Q4 at a pivotal inflection point as competing Fed-ECB policy paths and persistent inflation risks collide with major technical support.

AUD/USD Q4 Outlook: RBA and Fed Hikes Set the Tone
AUD/USD enters Q4 with RBA and Fed hikes in focus as sticky inflation, rising unemployment and US dollar strength shape the Australian dollar.

This report is intended for general circulation only. It should not be construed as a recommendation, or an offer (or solicitation of an offer) to buy or sell any financial products. The information provided does not take into account your specific investment objectives, financial situation or particular needs. Before you act on any recommendation that may be contained in this report, independent advice ought to be sought from a financial adviser regarding the suitability of the investment product, taking into account your specific investment objectives, financial situation or particular needs.
StoneX Financial Pte. Ltd., may distribute reports produced by its respective foreign entities or affiliates within the StoneX group of companies or third parties pursuant to an arrangement under Regulation 32C of the Financial Advisers Regulations. Where the report is distributed to a person in Singapore who is not an accredited investor, expert investor or an institutional investor (as defined in the Securities Futures Act), StoneX Financial Pte. Ltd. accepts legal responsibility to such persons for the contents of the report only to the extent required by law. Singapore recipients should contact StoneX Financial Pte. Ltd. at 6826 9988 for matters arising from, or in connection with the report.
In the case of all other recipients of this report, to the extent permitted by applicable laws and regulations neither StoneX Financial Pte. Ltd. nor its associated companies will be responsible or liable for any loss or damage incurred arising out of, or in connection with, any use of the information contained in this report and all such liability is hereby expressly disclaimed. No representation or warranty is made, express or implied, that the content of this report is complete or accurate.
StoneX Financial Pte. Ltd. is not under any obligation to update this report.
Trading CFDs carries a high level of risk that may not be suitable for some investors. Consider your investment objectives, level of experience, financial resources, risk appetite and other relevant circumstances carefully. The possibility exists that you could lose some or all of your investments, including your initial deposits. If in doubt, please seek independent expert advice. Visit www.forex.com/en-sg/terms-and-policies for the complete Risk Disclosure Statement.