




Greggs set to report 1st annual loss since IPO
Greggs is due to report on Tuesday 16th March, The pandemic is expected to have eaten a chunk out of profits.
Share this:

Greggs has already warned that the pandemic has eaten a slice out of profits and has said that it expects a full year loss in the region of £15 million compared to a profit of £108 million the year earlier. Full year sales are due in at £811 million down from £1.17 billion in 2019 so no huge surprises are expected there.
Instead, the focus will be on the current state of trading. Greggs has made changes to its business in order to survive as best as possible through the pandemic, such as click & collect and teaming up with Deliveroo. Even so management have said that they don’t expect profits to return until 2022 at the earliest.
Still investors remain upbeat regarding the prospects of the store with 100 now shops opening this year. The share price has rallied 75% from the pandemic lows and are around 10% from pre-pandemic levels.
Where next for Greggs share price?
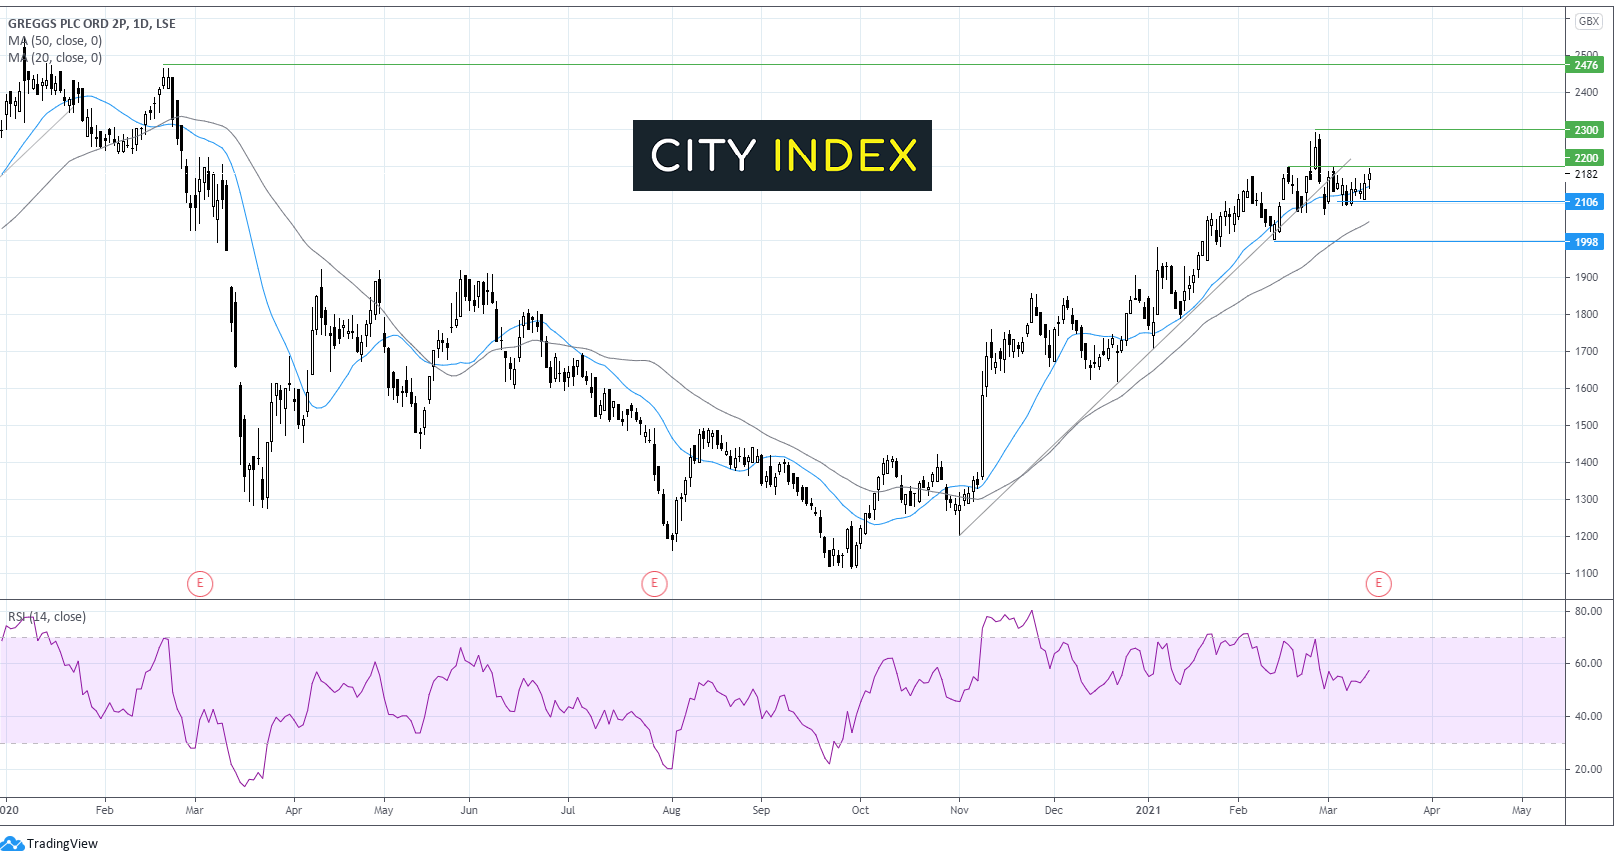
Greggs has traded in a firm uptrend since early November, although the rally appears to have run out of steam since the start of the month.
The share price has slipped below its three month ascending trendline after failing to push beyond 2200. The price has traded in a tight range of around 100 points since the start of the month capped on the upper side by 2200 and on the lower side by 2100.
The bias is very slightly tilted towards the upside, with the share price trading above the 50 sma and just above the 20 sma, whilst the RSI remains in bullish territory.
However, with results due tomorrow it could be prudent to wait for a breakout trade. A solid update and forward guidance could see the bulls push above 2200 to target near term resistance at 2300. A brea above this level would bring 2475 the pre-pandemic February high into play.
On the flip side. Disappointing numbers could see the bears take control. Sellers will be looking for a break below 2100 before support is tested at 2000 round number and February ’21 low. A breakthrough this level could negate the current bullish trend.
Learn more about trading equities
Greggs has already warned that the pandemic has eaten a slice out of profits and has said that it expects a full year loss in the region of £15 million compared to a profit of £108 million the year earlier. Full year sales are due in at £811 million down from £1.17 billion in 2019 so no huge surprises are expected there.
Instead, the focus will be on the current state of trading. Greggs has made changes to its business in order to survive as best as possible through the pandemic, such as click & collect and teaming up with Deliveroo. Even so management have said that they don’t expect profits to return until 2022 at the earliest.
Still investors remain upbeat regarding the prospects of the store with 100 now shops opening this year. The share price has rallied 75% from the pandemic lows and are around 10% from pre-pandemic levels.
Where next for Greggs share price?
Greggs has traded in a firm uptrend since early November, although the rally appears to have run out of steam since the start of the month.
The share price has slipped below its three month ascending trendline after failing to push beyond 2200. The price has traded in a tight range of around 100 points since the start of the month capped on the upper side by 2200 and on the lower side by 2100.
The bias is very slightly tilted towards the upside, with the share price trading above the 50 sma and just above the 20 sma, whilst the RSI remains in bullish territory.
However, with results due tomorrow it could be prudent to wait for a breakout trade. A solid update and forward guidance could see the bulls push above 2200 to target near term resistance at 2300. A brea above this level would bring 2475 the pre-pandemic February high into play.
On the flip side. Disappointing numbers could see the bears take control. Sellers will be looking for a break below 2100 before support is tested at 2000 round number and February ’21 low. A breakthrough this level could negate the current bullish trend.
Learn more about trading equities
Related tags:
Latest market news




Open an account in minutes
Experience award-winning platforms with fast and secure execution, and enjoy tight spreads from 0.5 pts on FX and 0.3 pts on indices.
Economic calendar
Web Trader platform
Our sophisticated web-based platform is packed with features.
Related articles

S&P 500, Nasdaq, Dow Forecast: Rising Yields Test Rally Ahead of Nvidia, Fed 8 22 2026
S&P 500, Nasdaq and Dow test key technical levels as momentum fades, raising the risk of a deeper correction heading into a pivotal week.


Magnificent Seven Earnings Preview: Can Big Tech Reclaim AI Leadership?
The Magnificent Seven enter earnings with far more divided performance than in previous years, as investors increasingly distinguish between companies supplying the AI buildout and those funding it - what does that mean heading into earnings season?


USD/JPY unwind accelerates as GPIF headlines spark yen buying
Japanese assets are rallying after the government floated the prospect of the GPIF investing more heavily at home. While the proposal could have significant implications for global capital flows, it does not yet change the broader forces driving Japanese bond yields and USD/JPY.
This report is intended for general circulation only. It should not be construed as a recommendation, or an offer (or solicitation of an offer) to buy or sell any financial products. The information provided does not take into account your specific investment objectives, financial situation or particular needs. Before you act on any recommendation that may be contained in this report, independent advice ought to be sought from a financial adviser regarding the suitability of the investment product, taking into account your specific investment objectives, financial situation or particular needs.
StoneX Financial Pte. Ltd., may distribute reports produced by its respective foreign entities or affiliates within the StoneX group of companies or third parties pursuant to an arrangement under Regulation 32C of the Financial Advisers Regulations. Where the report is distributed to a person in Singapore who is not an accredited investor, expert investor or an institutional investor (as defined in the Securities Futures Act), StoneX Financial Pte. Ltd. accepts legal responsibility to such persons for the contents of the report only to the extent required by law. Singapore recipients should contact StoneX Financial Pte. Ltd. at 6826 9988 for matters arising from, or in connection with the report.
In the case of all other recipients of this report, to the extent permitted by applicable laws and regulations neither StoneX Financial Pte. Ltd. nor its associated companies will be responsible or liable for any loss or damage incurred arising out of, or in connection with, any use of the information contained in this report and all such liability is hereby expressly disclaimed. No representation or warranty is made, express or implied, that the content of this report is complete or accurate.
StoneX Financial Pte. Ltd. is not under any obligation to update this report.
Trading CFDs carries a high level of risk that may not be suitable for some investors. Consider your investment objectives, level of experience, financial resources, risk appetite and other relevant circumstances carefully. The possibility exists that you could lose some or all of your investments, including your initial deposits. If in doubt, please seek independent expert advice. Visit www.forex.com/en-sg/terms-and-policies for the complete Risk Disclosure Statement.