




Has Gold Moved Too Far Too Fast
In less than 2 months, gold has moved over 150 points!
Share this:

As funds move out of risky assets, such as stocks, one of the asset classes that tend to benefit the most is precious metals. With the recent onslaught of negative data (such as the recent PMI data or the ZEW data released in Europe) and negative news from around the world (including the China-US trade war, the outcome of the primary elections in Argentina, or the protest situation in Hong Kong), one of the precious metals that tends to be most attractive is gold. Simply put, gold is considered a “flight to safety” asset.
From July of 2014 to June of this year, gold traded in sideways channel between 1122.50 and 1380. However, recently, Gold broke out of that channel and has traded as high as 1531. In less than 2 months, gold has moved over 150 points!
But why has Gold halted its ascent here at 1531? One fundamental reason is that the US said today that it will delay tariffs on some items until December 15th. However technically, we can see on a weekly chart that Gold is very close to Golden Fibonacci ratio of 161.8% of the move from the highs to the lows of the trading channel of the last 5 years.
Source: Tradingview, FOREX.com
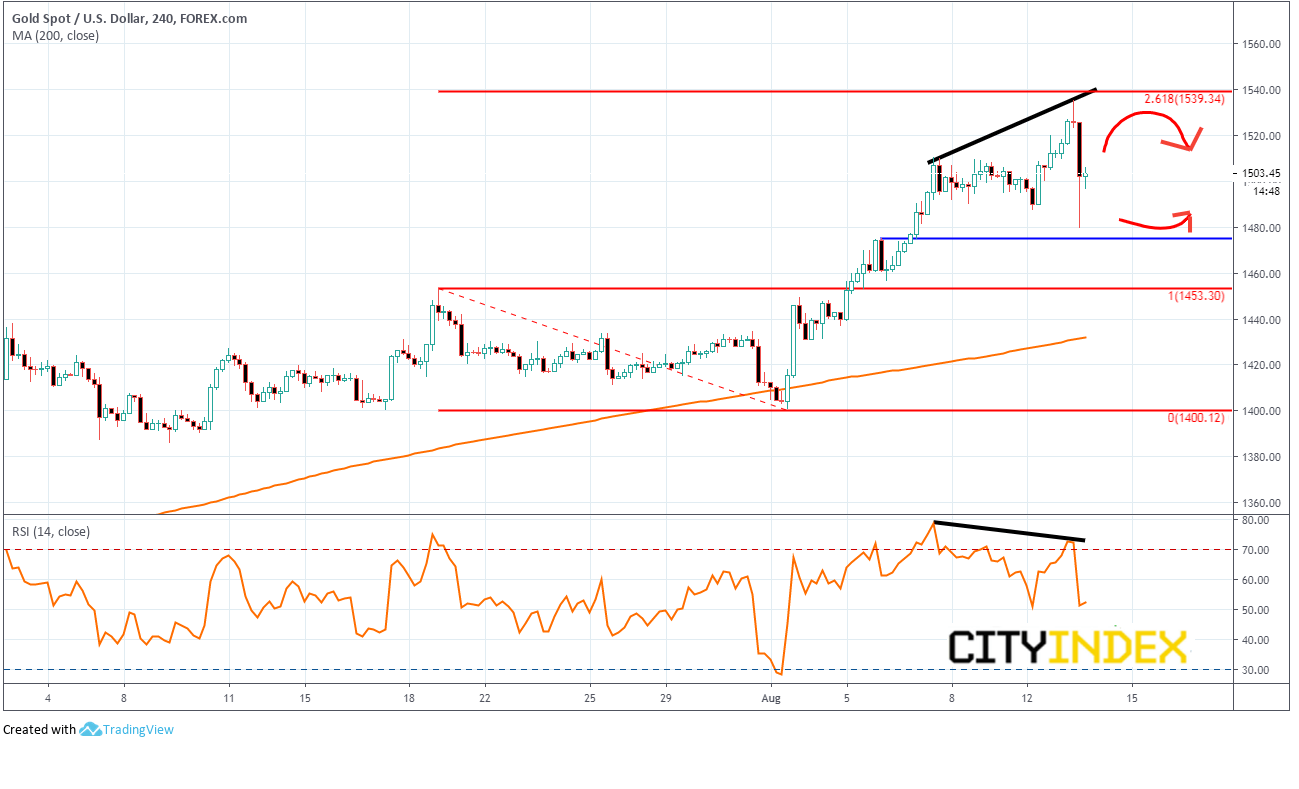
If we zoom in and take a look at a 240 minute chart, this makes our case more compelling:
- Gold has reached the 261.8% Fibonacci ratio of the move of the channel Gold was in from July 18th to August 5th.
- Gold was near the top of the rising trendline
- Gold has been diverging from the RSI since August 7th
- The RSI is in overbought territory
- At the highs, gold put in a shooting star candle, often indicative of a reversal.
Source: Tradingview, FOREX.com
As gold sold off, it did manage to hold horizontal support at 1474.2 and bounce back above 1500. China data out later and the ongoing geopolitical events need to be carefully monitored for direction. However, well defined support and resistance levels sit at 1474.2 and 1539.3.
As funds move out of risky assets, such as stocks, one of the asset classes that tend to benefit the most is precious metals. With the recent onslaught of negative data (such as the recent PMI data or the ZEW data released in Europe) and negative news from around the world (including the China-US trade war, the outcome of the primary elections in Argentina, or the protest situation in Hong Kong), one of the precious metals that tends to be most attractive is gold. Simply put, gold is considered a “flight to safety” asset.
From July of 2014 to June of this year, gold traded in sideways channel between 1122.50 and 1380. However, recently, Gold broke out of that channel and has traded as high as 1531. In less than 2 months, gold has moved over 150 points!
But why has Gold halted its ascent here at 1531? One fundamental reason is that the US said today that it will delay tariffs on some items until December 15th. However technically, we can see on a weekly chart that Gold is very close to Golden Fibonacci ratio of 161.8% of the move from the highs to the lows of the trading channel of the last 5 years.
Source: Tradingview, FOREX.com
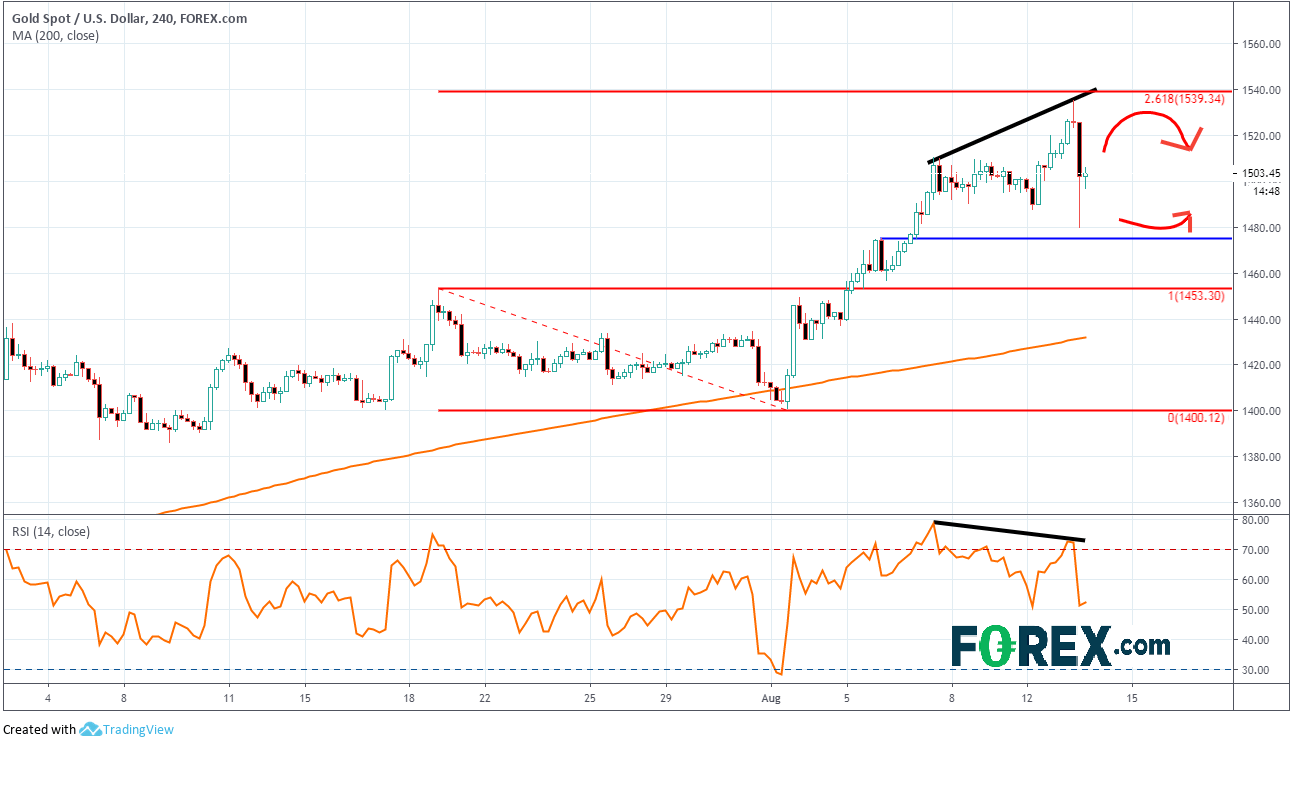
If we zoom in and take a look at a 240 minute chart, this makes our case more compelling:
- Gold has reached the 261.8% Fibonacci ratio of the move of the channel Gold was in from July 18th to August 5th.
- Gold was near the top of the rising trendline
- Gold has been diverging from the RSI since August 7th
- The RSI is in overbought territory
- At the highs, gold put in a shooting star candle, often indicative of a reversal.
Source: Tradingview, FOREX.com
As gold sold off, it did manage to hold horizontal support at 1474.2 and bounce back above 1500. China data out later and the ongoing geopolitical events need to be carefully monitored for direction. However, well defined support and resistance levels sit at 1474.2 and 1539.3.
Related tags:
Latest market news




Open an account in minutes
Experience award-winning platforms with fast and secure execution, and enjoy tight spreads from 0.5 pts on FX and 0.3 pts on indices.
Economic calendar
Web Trader platform
Our sophisticated web-based platform is packed with features.
Related articles

Gold forecast: XAU/USD could take a larger dive after the big rise in yields
Gold prices have been falling in the last few days after last week’s post-FOMC pop faded amid rising interest rate expectations, higher oil prices and a strengthening US dollar. As before, I wasn’t convinced gold would thrive in the current macro backdrop.


WTI Crude Oil Mulls Bounce from $90
Having fallen 17% from its cycle highs in just five days and now holding above $90, perhaps it could be time for crude oil to bounce over the near term.


Gold, silver slammed as hawkish Fed repricing reignites dollar upside
Gold and silver had held up surprisingly well against surging US yields. Wednesday’s DXY breakout may have changed that equation.

This report is intended for general circulation only. It should not be construed as a recommendation, or an offer (or solicitation of an offer) to buy or sell any financial products. The information provided does not take into account your specific investment objectives, financial situation or particular needs. Before you act on any recommendation that may be contained in this report, independent advice ought to be sought from a financial adviser regarding the suitability of the investment product, taking into account your specific investment objectives, financial situation or particular needs.
StoneX Financial Pte. Ltd., may distribute reports produced by its respective foreign entities or affiliates within the StoneX group of companies or third parties pursuant to an arrangement under Regulation 32C of the Financial Advisers Regulations. Where the report is distributed to a person in Singapore who is not an accredited investor, expert investor or an institutional investor (as defined in the Securities Futures Act), StoneX Financial Pte. Ltd. accepts legal responsibility to such persons for the contents of the report only to the extent required by law. Singapore recipients should contact StoneX Financial Pte. Ltd. at 6826 9988 for matters arising from, or in connection with the report.
In the case of all other recipients of this report, to the extent permitted by applicable laws and regulations neither StoneX Financial Pte. Ltd. nor its associated companies will be responsible or liable for any loss or damage incurred arising out of, or in connection with, any use of the information contained in this report and all such liability is hereby expressly disclaimed. No representation or warranty is made, express or implied, that the content of this report is complete or accurate.
StoneX Financial Pte. Ltd. is not under any obligation to update this report.
Trading CFDs carries a high level of risk that may not be suitable for some investors. Consider your investment objectives, level of experience, financial resources, risk appetite and other relevant circumstances carefully. The possibility exists that you could lose some or all of your investments, including your initial deposits. If in doubt, please seek independent expert advice. Visit www.forex.com/en-sg/terms-and-policies for the complete Risk Disclosure Statement.