



Index in focus: All eyes on 34K for Dow traders
Why this week’s price action could set the trading bias for US indices heading into September and beyond...
Share this:

After a solid day to start the week, the Dow Jones Industrial Average (Wall Street CFD) is gaining more ground today.
The proximate cause for this morning’s rally comes from the US consumer. Between a solid 11.6% y/y rise in Redbook’s weekly retail sales figure and strong results from both Walmart (WMT +5%) and Home Depot (HD +4%), traders are more confident that economic growth remains on sound footing, despite ongoing inflationary pressures.
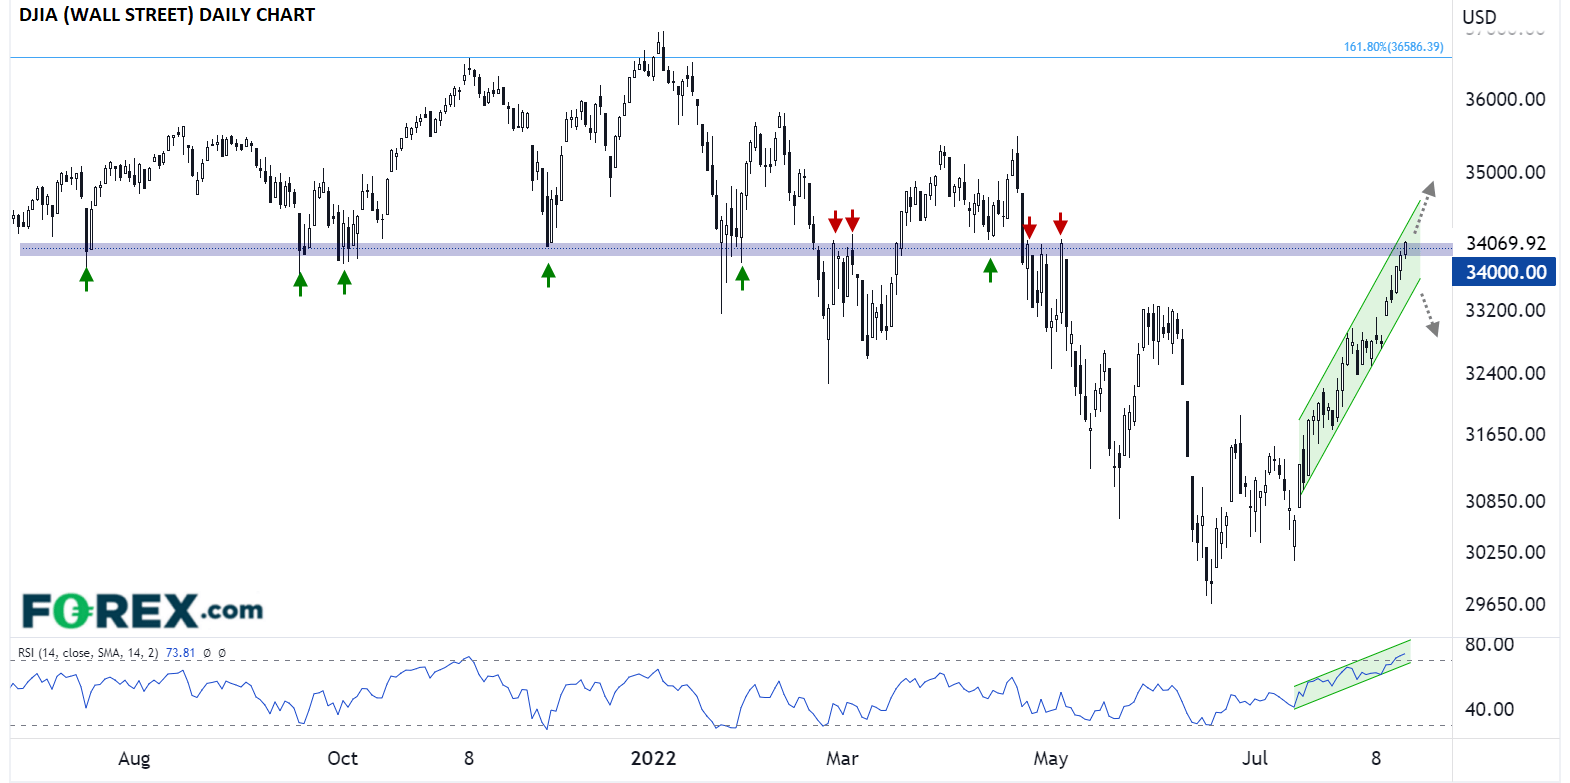
As we go to press, the Dow is testing arguably its most important price level of the past year at 34,000. Looking at the chart below, the index consistently found support near 34K in July, September, October, November and January, and, once breaking below it, found resistance at that same level in March and May. This price action underscores the technical principle of polarity, which states that a previous support level, once broken, becomes future resistance and vice versa.
All told, the price action suggests that the 34K level is a critical bull/bear delineation point, so a confirmed break above 34K would strengthen the near-term bullish bias and potentially pave the way for a move back toward record highs around 37K later this year. Meanwhile, a strong reversal off the 34K zone that breaks the near-term bullish channel would suggest that the most-followed US index has yet to shake off this year’s bearish momentum and would point a deeper retracement back below 32K.
Source: StoneX, TradingView
Despite the lack of top-tier economic data and generally lower liquidity due to “Dog Days of Summer” trade, this week’s price action could nonetheless set the trading bias for US indices heading into September and beyond.
How to trade with FOREX.com
Follow these easy steps to start trading with FOREX.com today:
- Open a Forex.com account, or log-in if you’re already a customer.
- Search for the pair you want to trade in our award-winning platform.
- Choose your position and size, and your stop and limit levels.
- Place the trade.
After a solid day to start the week, the Dow Jones Industrial Average (Wall Street CFD) is gaining more ground today.
The proximate cause for this morning’s rally comes from the US consumer. Between a solid 11.6% y/y rise in Redbook’s weekly retail sales figure and strong results from both Walmart (WMT +5%) and Home Depot (HD +4%), traders are more confident that economic growth remains on sound footing, despite ongoing inflationary pressures.
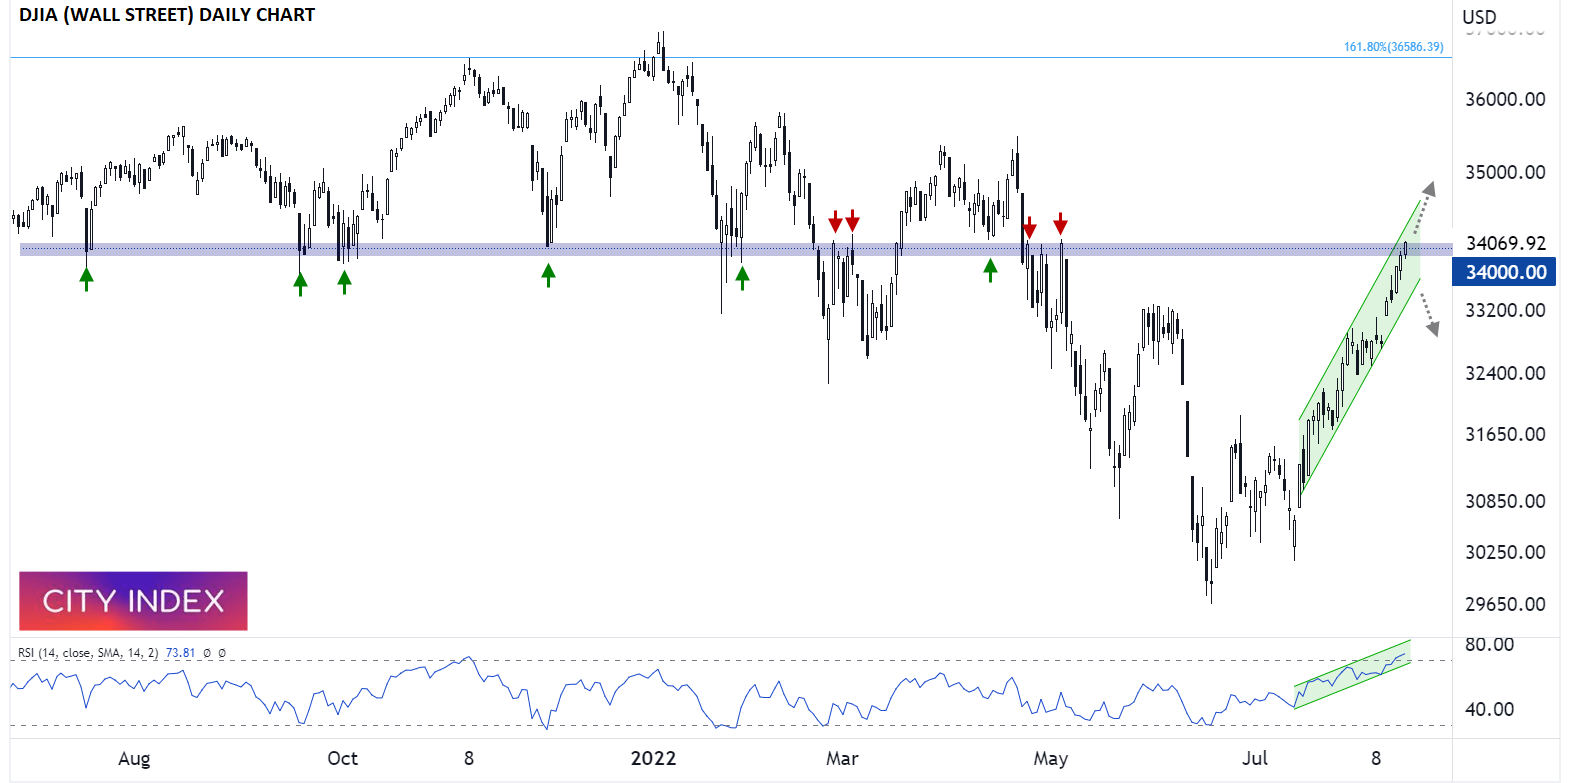
As we go to press, the Dow is testing arguably its most important price level of the past year at 34,000. Looking at the chart below, the index consistently found support near 34K in July, September, October, November and January, and, once breaking below it, found resistance at that same level in March and May. This price action underscores the technical principle of polarity, which states that a previous support level, once broken, becomes future resistance and vice versa.
All told, the price action suggests that the 34K level is a critical bull/bear delineation point, so a confirmed break above 34K would strengthen the near-term bullish bias and potentially pave the way for a move back toward record highs around 37K later this year. Meanwhile, a strong reversal off the 34K zone that breaks the near-term bullish channel would suggest that the most-followed US index has yet to shake off this year’s bearish momentum and would point a deeper retracement back below 32K.
Source: StoneX, TradingView
Despite the lack of top-tier economic data and generally lower liquidity due to “Dog Days of Summer” trade, this week’s price action could nonetheless set the trading bias for US indices heading into September and beyond.
How to trade with City Index
You can trade with City Index by following these four easy steps:
- Open an account, or log in if you’re already a customer
• Open an account in the UK
• Open an account in Australia
• Open an account in Singapore
- Search for the market you want to trade in our award-winning platform
- Choose your position and size, and your stop and limit levels
- Place the trade
Related tags:


Open an account in minutes
Experience award-winning platforms with fast and secure execution, and enjoy tight spreads from 0.5 pts on FX and 0.3 pts on indices.
Economic calendar
Web Trader platform
Our sophisticated web-based platform is packed with features.
Related articles

NZD/USD pressure mounts as payrolls looms large
NZD/USD has fallen sharply as Fed rate expectations reset higher, but extreme downside stretch and major support raise the risk of a violent counter-trend rebound.

US Core PCE Preview: Stale or Significant for the Fed
Core PCE inflation takes center stage Wednesday, with traders watching for signs of renewed price pressure and clues on whether the Fed could hike again in October.
Australian Dollar Forecast: AUD/USD Four-Week Slide Nears Critical Uptrend Support 9 29 2026
Aussie momentum has deteriorated sharply into quarter-end, with inflation, Core PCE and NFP on tap as AUD/USD closes in on a pivotal technical threshold.

This report is intended for general circulation only. It should not be construed as a recommendation, or an offer (or solicitation of an offer) to buy or sell any financial products. The information provided does not take into account your specific investment objectives, financial situation or particular needs. Before you act on any recommendation that may be contained in this report, independent advice ought to be sought from a financial adviser regarding the suitability of the investment product, taking into account your specific investment objectives, financial situation or particular needs.
StoneX Financial Pte. Ltd., may distribute reports produced by its respective foreign entities or affiliates within the StoneX group of companies or third parties pursuant to an arrangement under Regulation 32C of the Financial Advisers Regulations. Where the report is distributed to a person in Singapore who is not an accredited investor, expert investor or an institutional investor (as defined in the Securities Futures Act), StoneX Financial Pte. Ltd. accepts legal responsibility to such persons for the contents of the report only to the extent required by law. Singapore recipients should contact StoneX Financial Pte. Ltd. at 6826 9988 for matters arising from, or in connection with the report.
In the case of all other recipients of this report, to the extent permitted by applicable laws and regulations neither StoneX Financial Pte. Ltd. nor its associated companies will be responsible or liable for any loss or damage incurred arising out of, or in connection with, any use of the information contained in this report and all such liability is hereby expressly disclaimed. No representation or warranty is made, express or implied, that the content of this report is complete or accurate.
StoneX Financial Pte. Ltd. is not under any obligation to update this report.
Trading CFDs carries a high level of risk that may not be suitable for some investors. Consider your investment objectives, level of experience, financial resources, risk appetite and other relevant circumstances carefully. The possibility exists that you could lose some or all of your investments, including your initial deposits. If in doubt, please seek independent expert advice. Visit www.forex.com/en-sg/terms-and-policies for the complete Risk Disclosure Statement.