




Is USDCHF trying to tell us something about DXY
If the 2 assets are truly, positively correlated, one may expect that the DXY will bounce soon
Share this:

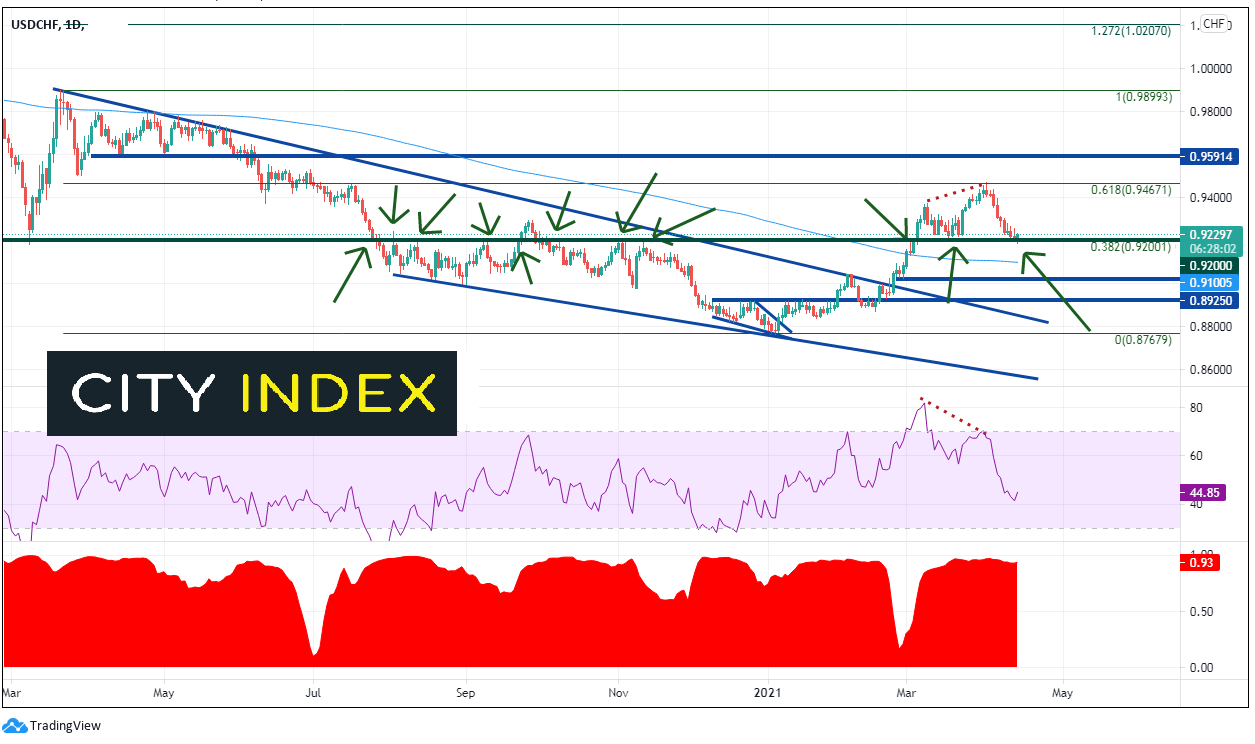
DXY and USD/CHF is known to have a positive correlation, and it’s usually a strong one. As such, when traders don’t have access to the DXY, they sometimes trade USD/CHF as a proxy. Except for a brief dip in late February, the correlation between the 2 assets has been above +0.90 for most of 2021. The current correlation coefficient is +0.93. A correlation coefficient of +1.00 means that the two assets are perfectly correlated and move together on a 1-for-1 basis. A reading of +0.93 is pretty close! USD/CHF hit a key inflection point today at 0.9200 and bounced. This level has acted as both support and resistance many times. Does this mean that the DXY is ready for a bounce as well?
Source: Tradingview, City Index
USD/CHF had been trading in a descending wedge from March 2020 until late February 2021. The pair broke higher above the top downward sloping trendline on February 23rd. The target for the breakout of a descending wedge is a 100% retracement of the wedge. The pair moved aggressively towards the target, crossing through the 200 Day Moving Average and the key 0.9200 level along the way. USD/CHF stalled on April 1st at the 61.8% Fibonacci retracement level from the March 23rd, 2020 highs to the January 6th lows, near 0.9467. At the time, the RSI was above 80 and diverging with price. USD/CHF has corrected since then and, today, put in a low on 0.9187 and bounced back above 0.9200. This level is also the 38.2% Fibonacci retracement from the lows of February 23rd to the highs on April 1st. Support is at the 92.00 level (or todays lows at 0.9187) and then the 200 Day Moving Average near 0.9100. Resistance is at yesterday’s highs near 0.9259. If price breaks above, it can run back towards the April 1st highs at 0.9467!
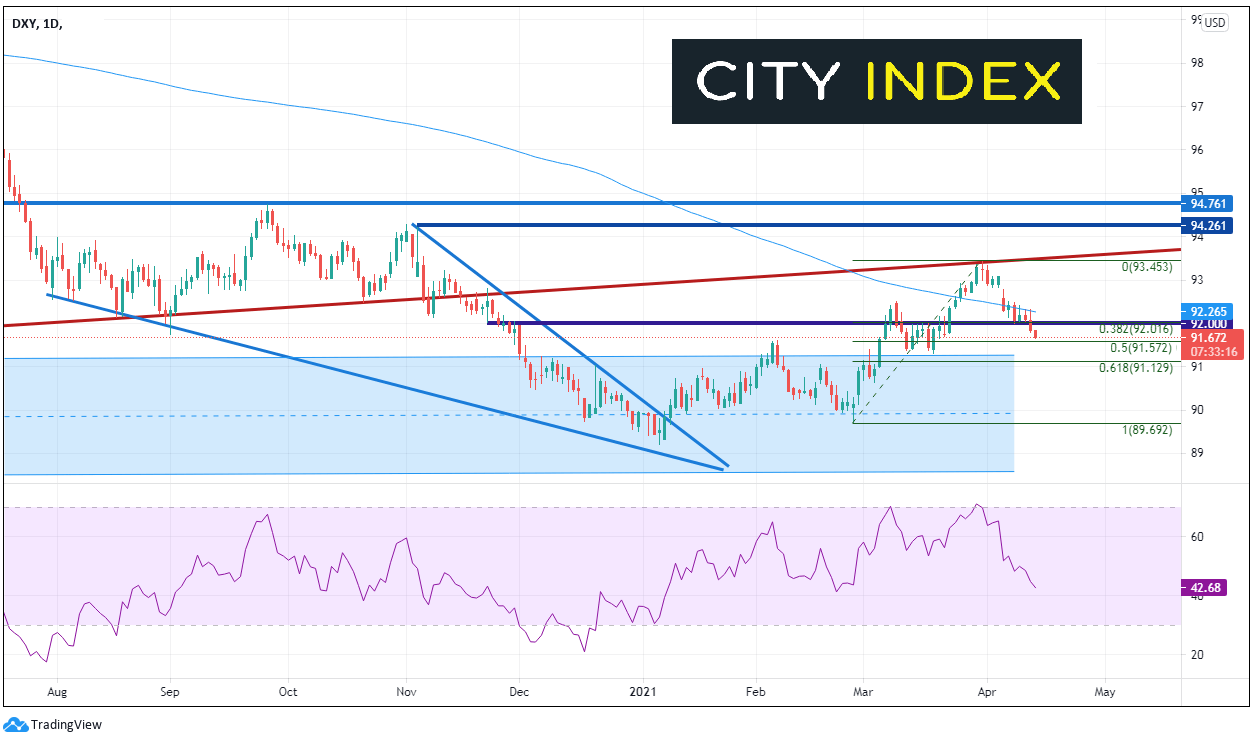
The price action in the DXY has been similar to that of USD/CHF. DXY had been moving lower since March 2020 as well. The US Dollar Index began moving higher on February 25th (2 days after USD/CHF bottomed) and stalled on its way toward a descending wedge target, putting in a high on March 31st (1 day prior to USD/CHF). However, as DXY pulled back, it took out horizontal support AND the 38.2% Fibonacci retracement from the February lows to the March 31st highs (whereas USD/CHF did not). Support is now at the 50% Fibonacci retracement level from the same timeframe near 91.57, and then the March 18th lows and horizontal resistance near 91.30. Horizontal resistance is at yesterday’s high and the 200 Day Moving Average near 92.26.
Source: Tradingview, City Index
The DXY has moved lower relative to USD/CHF since April 1st and is approaching support at the previously mentioned 50% retracement level. USD/CHF tested support today and bounced. If the 2 assets are truly, positively correlated, one may expect that the DXY will bounce soon as well.
Learn more about forex trading opportunities
DXY and USD/CHF is known to have a positive correlation, and it’s usually a strong one. As such, when traders don’t have access to the DXY, they sometimes trade USD/CHF as a proxy. Except for a brief dip in late February, the correlation between the 2 assets has been above +0.90 for most of 2021. The current correlation coefficient is +0.93. A correlation coefficient of +1.00 means that the two assets are perfectly correlated and move together on a 1-for-1 basis. A reading of +0.93 is pretty close! USD/CHF hit a key inflection point today at 0.9200 and bounced. This level has acted as both support and resistance many times. Does this mean that the DXY is ready for a bounce as well?
Source: Tradingview, FOREX.com
USD/CHF had been trading in a descending wedge from March 2020 until late February 2021. The pair broke higher above the top downward sloping trendline on February 23rd. The target for the breakout of a descending wedge is a 100% retracement of the wedge. The pair moved aggressively towards the target, crossing through the 200 Day Moving Average and the key 0.9200 level along the way. USD/CHF stalled on April 1st at the 61.8% Fibonacci retracement level from the March 23rd, 2020 highs to the January 6th lows, near 0.9467. At the time, the RSI was above 80 and diverging with price. USD/CHF has corrected since then and, today, put in a low on 0.9187 and bounced back above 0.9200. This level is also the 38.2% Fibonacci retracement from the lows of February 23rd to the highs on April 1st. Support is at the 92.00 level (or todays lows at 0.9187) and then the 200 Day Moving Average near 0.9100. Resistance is at yesterday’s highs near 0.9259. If price breaks above, it can run back towards the April 1st highs at 0.9467!
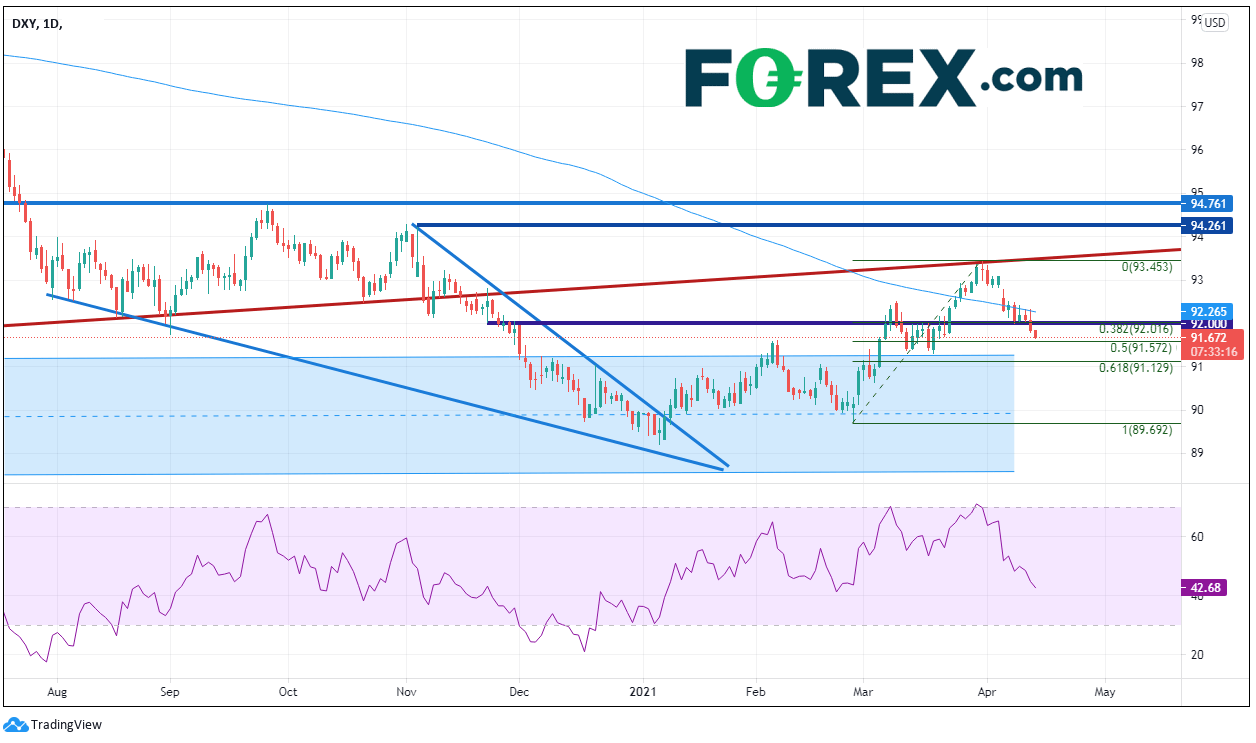
The price action in the DXY has been similar to that of USD/CHF. DXY had been moving lower since March 2020 as well. The US Dollar Index began moving higher on February 25th (2 days after USD/CHF bottomed) and stalled on its way toward a descending wedge target, putting in a high on March 31st (1 day prior to USD/CHF). However, as DXY pulled back, it took out horizontal support AND the 38.2% Fibonacci retracement from the February lows to the March 31st highs (whereas USD/CHF did not). Support is now at the 50% Fibonacci retracement level from the same timeframe near 91.57, and then the March 18th lows and horizontal resistance near 91.30. Horizontal resistance is at yesterday’s high and the 200 Day Moving Average near 92.26.
Source: Tradingview, FOREX.com
The DXY has moved lower relative to USD/CHF since April 1st and is approaching support at the previously mentioned 50% retracement level. USD/CHF tested support today and bounced. If the 2 assets are truly, positively correlated, one may expect that the DXY will bounce soon as well.
Learn more about forex trading opportunities
Related tags:
Latest market news




Open an account in minutes
Experience award-winning platforms with fast and secure execution, and enjoy tight spreads from 0.5 pts on FX and 0.3 pts on indices.
Economic calendar
Web Trader platform
Our sophisticated web-based platform is packed with features.
Related articles
RBA delivers 25bp hike, Bullock now the main event
The RBA delivered the expected 25bp hike, but Bullock’s press conference now looms as the bigger volatility risk for AUD/USD and the ASX 200.
Gold outlook: XAU/USD hammered, stretched and vulnerable to a sharp rebound
Gold is getting hammered for solid fundamental reasons, but history suggests extreme four-hourly oversold conditions can produce violent countertrend rallies.
EUR/USD, USD/JPY Outlook: Oil, yields and an FX identity crisis
Crude oil is setting the tone across rates and FX, leaving EUR/USD vulnerable and USD/JPY caught between higher Treasury yields and the growing threat of intervention
This report is intended for general circulation only. It should not be construed as a recommendation, or an offer (or solicitation of an offer) to buy or sell any financial products. The information provided does not take into account your specific investment objectives, financial situation or particular needs. Before you act on any recommendation that may be contained in this report, independent advice ought to be sought from a financial adviser regarding the suitability of the investment product, taking into account your specific investment objectives, financial situation or particular needs.
StoneX Financial Pte. Ltd., may distribute reports produced by its respective foreign entities or affiliates within the StoneX group of companies or third parties pursuant to an arrangement under Regulation 32C of the Financial Advisers Regulations. Where the report is distributed to a person in Singapore who is not an accredited investor, expert investor or an institutional investor (as defined in the Securities Futures Act), StoneX Financial Pte. Ltd. accepts legal responsibility to such persons for the contents of the report only to the extent required by law. Singapore recipients should contact StoneX Financial Pte. Ltd. at 6826 9988 for matters arising from, or in connection with the report.
In the case of all other recipients of this report, to the extent permitted by applicable laws and regulations neither StoneX Financial Pte. Ltd. nor its associated companies will be responsible or liable for any loss or damage incurred arising out of, or in connection with, any use of the information contained in this report and all such liability is hereby expressly disclaimed. No representation or warranty is made, express or implied, that the content of this report is complete or accurate.
StoneX Financial Pte. Ltd. is not under any obligation to update this report.
Trading CFDs carries a high level of risk that may not be suitable for some investors. Consider your investment objectives, level of experience, financial resources, risk appetite and other relevant circumstances carefully. The possibility exists that you could lose some or all of your investments, including your initial deposits. If in doubt, please seek independent expert advice. Visit www.forex.com/en-sg/terms-and-policies for the complete Risk Disclosure Statement.