



July housing data concludes on a mixed note; waiting on Jackson Hole
July housing data finished up this week with worse than expected New Home Sales and better than expected Pending Home Sales.
Share this:

Last week, we summarized July’s housing data as poor. The release of July’s housing data concluded this week with the release of New Home Sales and Pending Home Sales. The results were mixed for the more recent data. New Home Sales was -12.6% MoM vs -3% MoM expected and -7.1% MoM in June. This was the lowest reading since January 2016. However, Pending Home Sales for July were not as bad at -1% MoM vs an expectation of -4% MoM and a June print of -8.9% MoM. Although the July print was better than expected, it’s still negative and points to a slowdown in the housing market. The poor housing data for July was primarily due to higher mortgage rates and stale housing prices, as buyers and sellers are not yet willing to budge on price.
When will markets get the next signal for the housing market? It could possibly be as soon as Friday when Fed Chairman Powell speaks at the Jackson Hole Symposium. If Powell is more hawkish and expected, 10-year rates may increase and in-turn, so will mortgage rates. However, if Powell is more dovish than expected and hints at a Fed pivot, bond yields should move lower and drag mortgage rates lower as well.
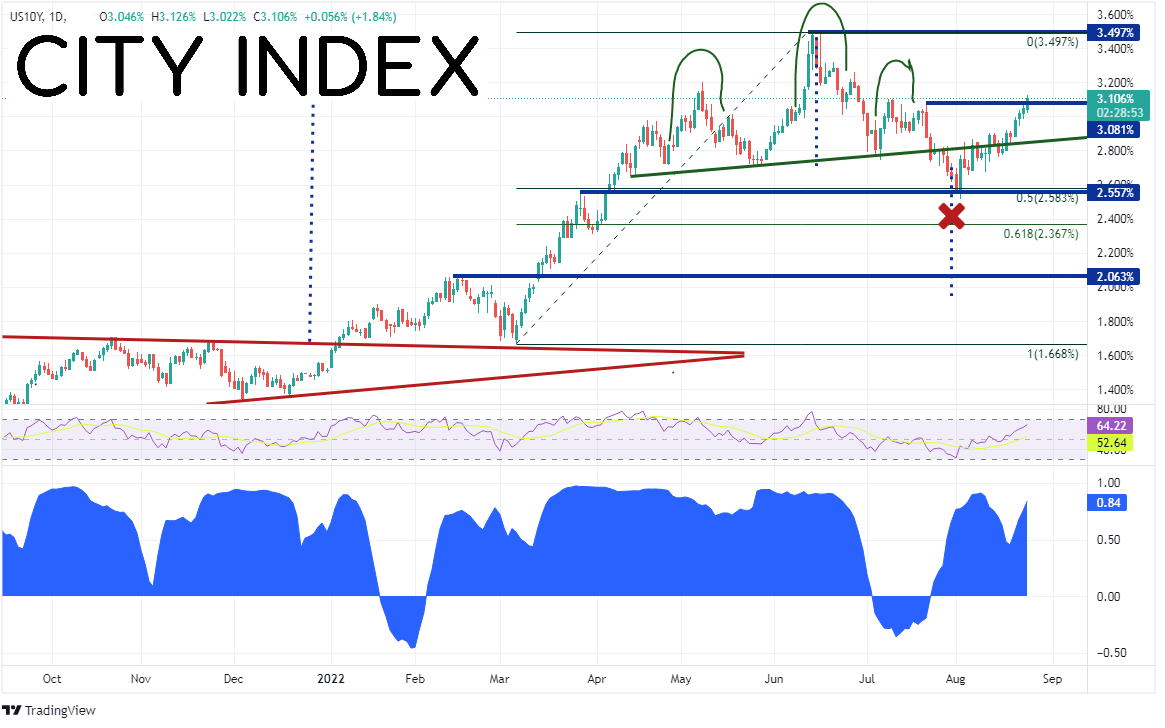
US 10 Year Yields reached their highest level since 2011 on June 14th at 3.497%. Yields then moved lower, broke the neckline of a head and shoulders pattern on July 22nd and fell to support at 2.516%. This was just below horizontal support and the 50% retracement from the low of May 7th to the highs of July 14th. The support held and yields reversed, negating the head and shoulders pattern. Yields have been moving higher since then and are currently trading at their highest level in nearly 2 months. Notice the correlation coefficient between US 10 Year Yields and USD/JPY in the bottom panel. The current correlation is +0.84. Readings above +0.80 are considered to be strong positive correlations. Therefore, as long as the correlation coefficient remains above +0.80, 10 Year Yields and USD/JPY should move in the same direction.

Source: Tradingview, Stone X
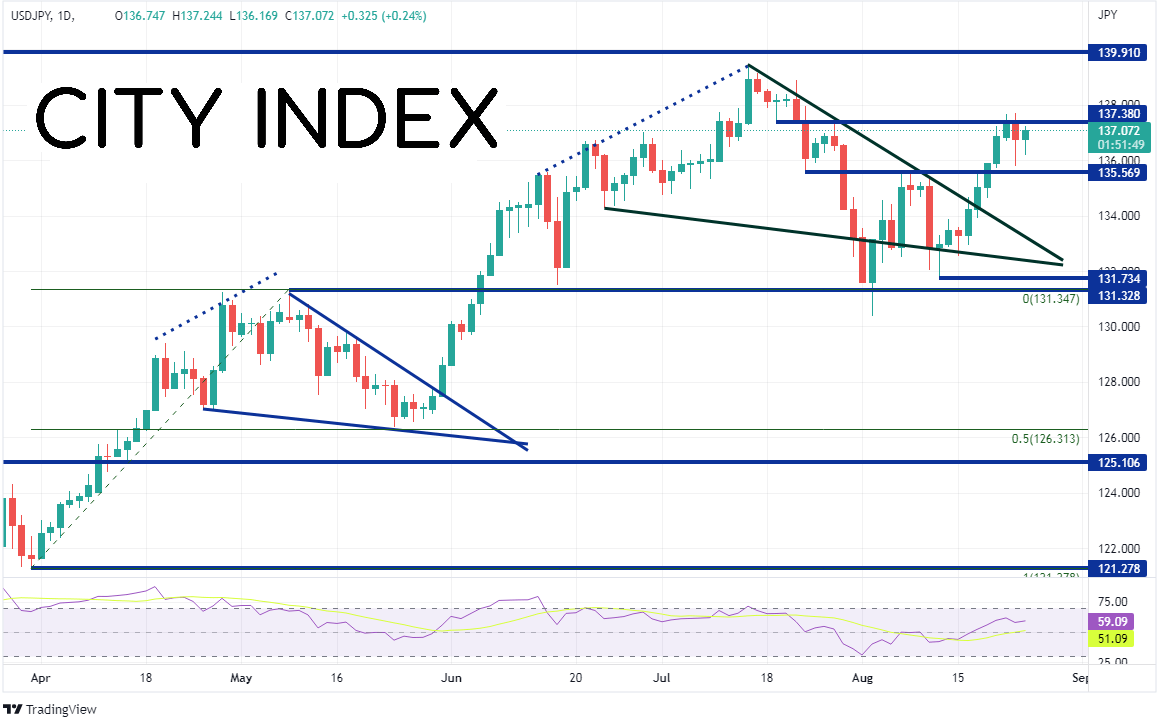
USD/JPY broke above a descending wedge on May 31st, continuing its impulsive move higher. On July 14th the pair reached its highest level since 1998 at 139.39 before pulling back in another descending wedge. USD/JPY broke below the descending wedge on August 1st, reaching a low of 130.39 but holding support. The next day, price traded back into the wedge and broke above it on August 17th. Yesterday, price made a high of 137.70 as price waits for the next catalyst for more direction (Jackson Hole?). First resistance is at the August 23rd highs of 137.70. Above there, price can move to the highs from July 14th at 1.3939 and then the highs of September 1998 at 139.91. However, if USD/JPY pulls back, first horizontal support is at 135.57. Below there, price can pull back to the top downward sloping trendline of the descending wedge near 133.15, then the bottom trendline of the wedge at 132.35.

Source: Tradingview, Stone X
July housing data finished up this week with worse than expected New Home Sales and better than expected Pending Home Sales. The housing data overall for the month of July has been poor, primarily due to rising interest/mortgage rates. As a result of higher yields, USD/JPY has been moving higher as well. Will it continue? We may have to wait until Fed Chairman Powell’s Jackson Hole speech on Friday to find out!
Last week, we summarized July’s housing data as poor. The release of July’s housing data concluded this week with the release of New Home Sales and Pending Home Sales. The results were mixed for the more recent data. New Home Sales was -12.6% MoM vs -3% MoM expected and -7.1% MoM in June. This was the lowest reading since January 2016. However, Pending Home Sales for July were not as bad at -1% MoM vs an expectation of -4% MoM and a June print of -8.9% MoM. Although the July print was better than expected, it’s still negative and points to a slowdown in the housing market. The poor housing data for July was primarily due to higher mortgage rates and stale housing prices, as buyers and sellers are not yet willing to budge on price.
When will markets get the next signal for the housing market? It could possibly be as soon as Friday when Fed Chairman Powell speaks at the Jackson Hole Symposium. If Powell is more hawkish and expected, 10-year rates may increase and in-turn, so will mortgage rates. However, if Powell is more dovish than expected and hints at a Fed pivot, bond yields should move lower and drag mortgage rates lower as well.
How do interest rates impact financial markets?
US 10 Year Yields reached their highest level since 2011 on June 14th at 3.497%. Yields then moved lower, broke the neckline of a head and shoulders pattern on July 22nd and fell to support at 2.516%. This was just below horizontal support and the 50% retracement from the low of May 7th to the highs of July 14th. The support held and yields reversed, negating the head and shoulders pattern. Yields have been moving higher since then and are currently trading at their highest level in nearly 2 months. Notice the correlation coefficient between US 10 Year Yields and USD/JPY in the bottom panel. The current correlation is +0.84. Readings above +0.80 are considered to be strong positive correlations. Therefore, as long as the correlation coefficient remains above +0.80, 10 Year Yields and USD/JPY should move in the same direction.
Source: Tradingview, Stone X
Trade Interest Rates now: Login or Open a new account!
• Open an account in the UK
• Open an account in Australia
• Open an account in Singapore
USD/JPY broke above a descending wedge on May 31st, continuing its impulsive move higher. On July 14th the pair reached its highest level since 1998 at 139.39 before pulling back in another descending wedge. USD/JPY broke below the descending wedge on August 1st, reaching a low of 130.39 but holding support. The next day, price traded back into the wedge and broke above it on August 17th. Yesterday, price made a high of 137.70 as price waits for the next catalyst for more direction (Jackson Hole?). First resistance is at the August 23rd highs of 137.70. Above there, price can move to the highs from July 14th at 1.3939 and then the highs of September 1998 at 139.91. However, if USD/JPY pulls back, first horizontal support is at 135.57. Below there, price can pull back to the top downward sloping trendline of the descending wedge near 133.15, then the bottom trendline of the wedge at 132.35.
Source: Tradingview, Stone X
Trade USD/JPY now: Login or Open a new account!
• Open an account in the UK
• Open an account in Australia
• Open an account in Singapore
July housing data finished up this week with worse than expected New Home Sales and better than expected Pending Home Sales. The housing data overall for the month of July has been poor, primarily due to rising interest/mortgage rates. As a result of higher yields, USD/JPY has been moving higher as well. Will it continue? We may have to wait until Fed Chairman Powell’s Jackson Hole speech on Friday to find out!
Learn more about forex trading opportunities.
Related tags:
Latest market news



Open an account in minutes
Experience award-winning platforms with fast and secure execution, and enjoy tight spreads from 0.5 pts on FX and 0.3 pts on indices.
Economic calendar
Web Trader platform
Our sophisticated web-based platform is packed with features.
Related articles
EUR/USD weekly outlook: Oil, inflation and NFP in focus
After coming under significant pressure in recent weeks, the EUR/USD came off its lows to finish the week on a positive note on Friday, albeit with only a mild rebound. That was not enough to prevent the exchange rate falling for the third consecutive week, as the US dollar and bond yields rallied across the board.

Gold Q4 2026 outlook: Resilience in the face of rallying dollar and yields
As we headed towards the latter stages of Q3 and into Q4, the Fed had just hiked rates in a hawkish FOMC meeting, while the likes of the ECB and BoJ had also tightened their respective policies. Oil prices remained elevated amid the prolonged US-Iran conflict. Meanwhile, bond yields were breaking out, and the dollar was higher across the board. Yet, remarkably, gold was still holding in the positive territory for the third quarter, even if it had weakened somewhat in September.

EUR/USD Q4 2026 Outlook: Euro at a Crossroads as Fed, ECB Tighten 9 25 2026
EUR/USD enters Q4 at a pivotal inflection point as competing Fed-ECB policy paths and persistent inflation risks collide with major technical support.
This report is intended for general circulation only. It should not be construed as a recommendation, or an offer (or solicitation of an offer) to buy or sell any financial products. The information provided does not take into account your specific investment objectives, financial situation or particular needs. Before you act on any recommendation that may be contained in this report, independent advice ought to be sought from a financial adviser regarding the suitability of the investment product, taking into account your specific investment objectives, financial situation or particular needs.
StoneX Financial Pte. Ltd., may distribute reports produced by its respective foreign entities or affiliates within the StoneX group of companies or third parties pursuant to an arrangement under Regulation 32C of the Financial Advisers Regulations. Where the report is distributed to a person in Singapore who is not an accredited investor, expert investor or an institutional investor (as defined in the Securities Futures Act), StoneX Financial Pte. Ltd. accepts legal responsibility to such persons for the contents of the report only to the extent required by law. Singapore recipients should contact StoneX Financial Pte. Ltd. at 6826 9988 for matters arising from, or in connection with the report.
In the case of all other recipients of this report, to the extent permitted by applicable laws and regulations neither StoneX Financial Pte. Ltd. nor its associated companies will be responsible or liable for any loss or damage incurred arising out of, or in connection with, any use of the information contained in this report and all such liability is hereby expressly disclaimed. No representation or warranty is made, express or implied, that the content of this report is complete or accurate.
StoneX Financial Pte. Ltd. is not under any obligation to update this report.
Trading CFDs carries a high level of risk that may not be suitable for some investors. Consider your investment objectives, level of experience, financial resources, risk appetite and other relevant circumstances carefully. The possibility exists that you could lose some or all of your investments, including your initial deposits. If in doubt, please seek independent expert advice. Visit www.forex.com/en-sg/terms-and-policies for the complete Risk Disclosure Statement.