




Make It or Break It for The Australian Dollar
China seems to be back in business after being shut down completely for 2 months.
Share this:

China reported a trade surplus for March earlier today at +19.90B vs -7.09B for the combined January-February period. China seems to be back in business after being shut down completely for 2 months. Additional data will be released later in the week. However, all eyes will now focus on if they can keep the coronavirus at bay, as a few flare ups have developed in a few areas.
Australia relies heavily on China as a trading partner. As such, as the economy of China goes, so does the economy of Australia. Traders have been anticipating China’s improved data for the last month as China began re-opening its factories and the economy. As a result, the Australian Dollar has been moving higher as well.
But now, pairs such as AUD/USD and AUD/JPY are at a point where they need to break though significant resistance to reach their previous February levels, or they will roll over and head lower.
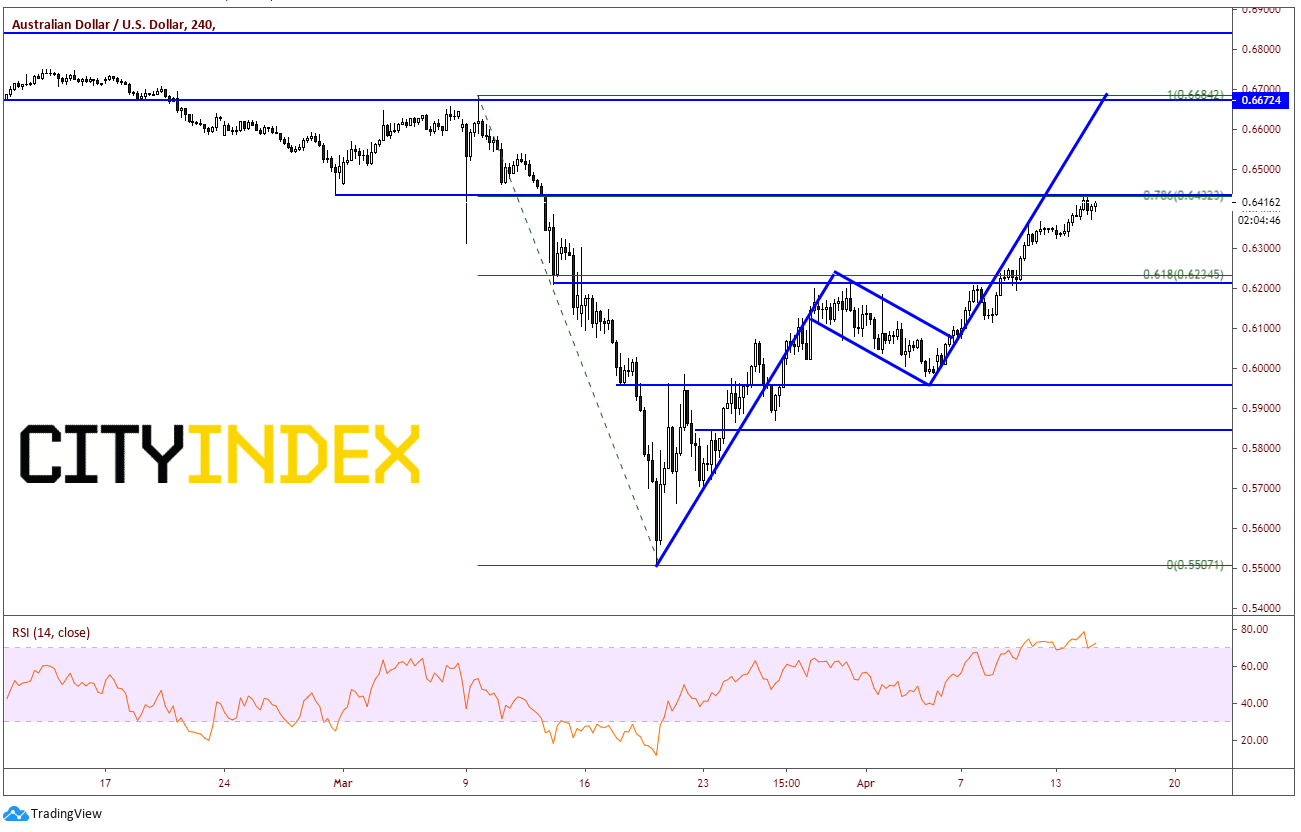
On a 240-minute AUD/USD chart, the pair has broken out of a pennant formation, with a target near the March 9th highs and previous support (now acting as resistance) at February’s lows. However, price has stalled (at the less often looked) at 78.6% Fibonacci retracement level from the March 9th highs to the March 18th lows at .6433. In addition, this level happens to be horizontal resistance. The RSI is also in overbought conditions, however still pointing higher. If AUD/USD can break through .6450, price could run back up to prior highs near .6675. If price fails from here, support is back at the 61.8% retracement levef near .6234/.6250.
Source: Tradingview, City Index
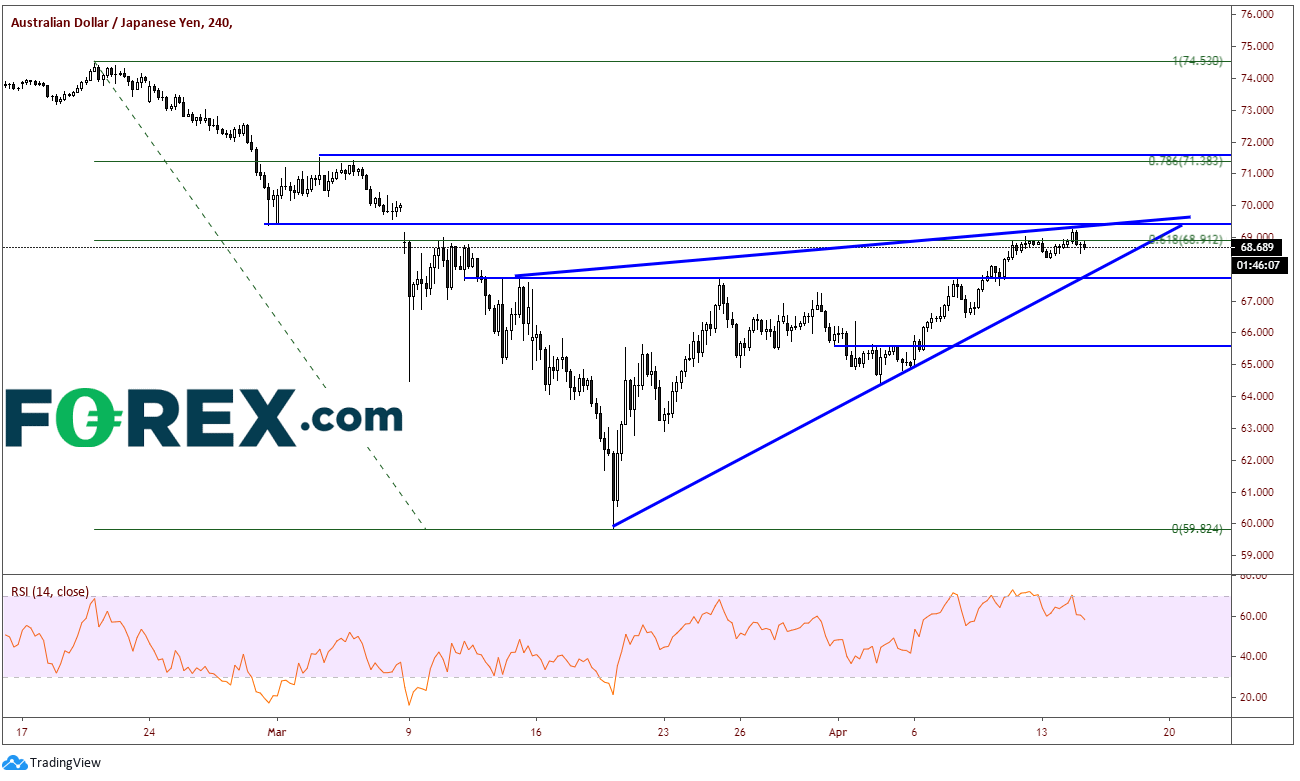
On a 240-minute AUD/JPY chart, there is a similar pattern that has set up. Here, price has traded into the gap from March 9th and is up against horizontal resistance at 69.40. In addition, price has stalled at the 61.8% Fibonacci retracement from the February 20th highs to the March 18th lows. However, price has not yet filled the gap and is trading in an ascending wedge formation. If AUD/JPY can break higher and fill the gap near 69.75, price should be able to run up to horizontal resistance near 71.50 and then a full retracement up to 74.50. If price fails and breaks lower out of the ascending wedge, the target would be a long way down, back to 60.00! There will be a great deal of support along the way though, such as the upward sloping trendline and horizontal support convergence near 67.70 and horizontal support near 65.60.
Source: Tradingview, City Index
The US is also discussing re-opening the economy. If that happens “sooner than later”, equities should also continue to climb, and bring AUD/USD with it. Watch both China and the US for new information regarding the coronavirus to help determine the next direction if the Australian Dollar!
China reported a trade surplus for March earlier today at +19.90B vs -7.09B for the combined January-February period. China seems to be back in business after being shut down completely for 2 months. Additional data will be released later in the week. However, all eyes will now focus on if they can keep the coronavirus at bay, as a few flare ups have developed in a few areas.
Australia relies heavily on China as a trading partner. As such, as the economy of China goes, so does the economy of Australia. Traders have been anticipating China’s improved data for the last month as China began re-opening its factories and the economy. As a result, the Australian Dollar has been moving higher as well.
But now, pairs such as AUD/USD and AUD/JPY are at a point where they need to break though significant resistance to reach their previous February levels, or they will roll over and head lower.
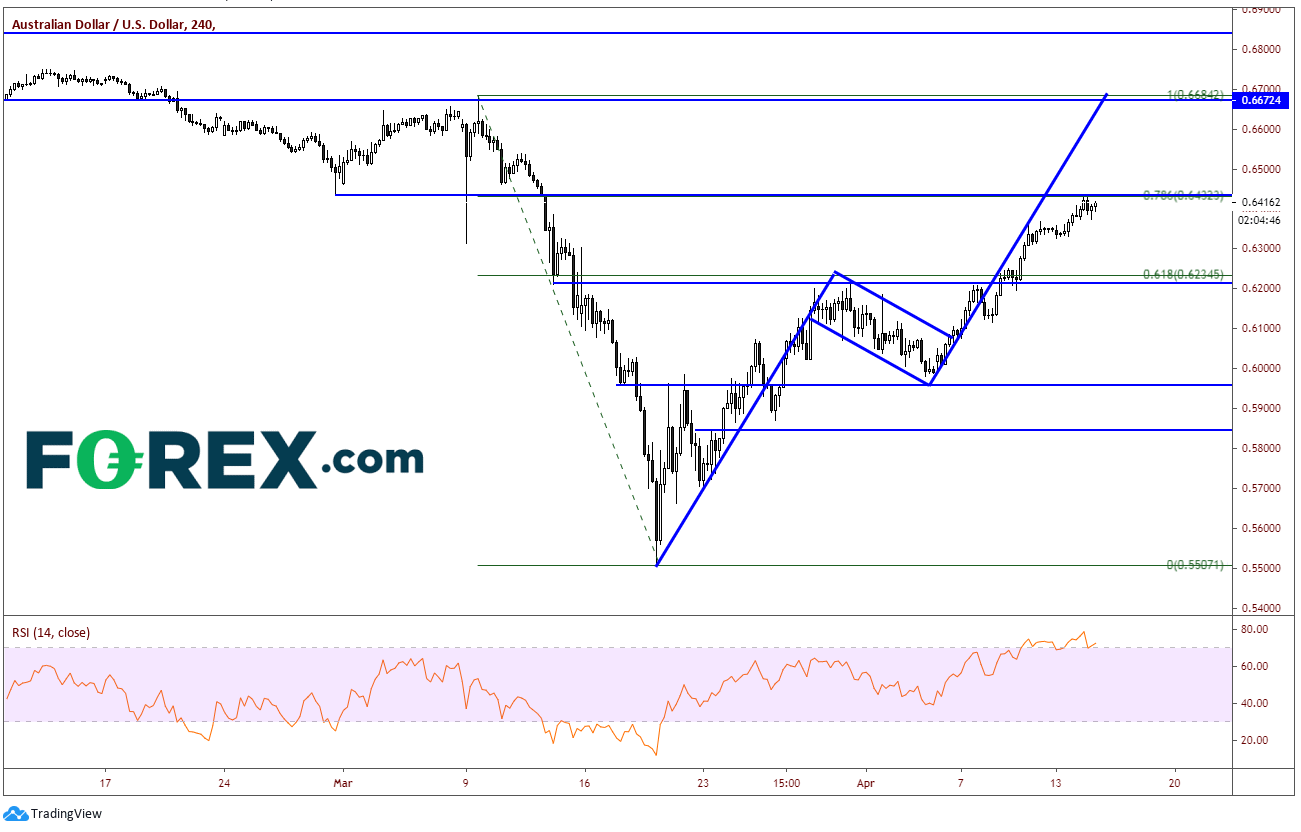
On a 240-minute AUD/USD chart, the pair has broken out of a pennant formation, with a target near the March 9th highs and previous support (now acting as resistance) at February’s lows. However, price has stalled (at the less often looked) at 78.6% Fibonacci retracement level from the March 9th highs to the March 18th lows at .6433. In addition, this level happens to be horizontal resistance. The RSI is also in overbought conditions, however still pointing higher. If AUD/USD can break through .6450, price could run back up to prior highs near .6675. If price fails from here, support is back at the 61.8% retracement levef near .6234/.6250.
Source: Tradingview, FOREX.com
On a 240-minute AUD/JPY chart, there is a similar pattern that has set up. Here, price has traded into the gap from March 9th and is up against horizontal resistance at 69.40. In addition, price has stalled at the 61.8% Fibonacci retracement from the February 20th highs to the March 18th lows. However, price has not yet filled the gap and is trading in an ascending wedge formation. If AUD/JPY can break higher and fill the gap near 69.75, price should be able to run up to horizontal resistance near 71.50 and then a full retracement up to 74.50. If price fails and breaks lower out of the ascending wedge, the target would be a long way down, back to 60.00! There will be a great deal of support along the way though, such as the upward sloping trendline and horizontal support convergence near 67.70 and horizontal support near 65.60.
Source: Tradingview, FOREX.com
The US is also discussing re-opening the economy. If that happens “sooner than later”, equities should also continue to climb, and bring AUD/USD with it. Watch both China and the US for new information regarding the coronavirus to help determine the next direction if the Australian Dollar!
Latest market news



Open an account in minutes
Experience award-winning platforms with fast and secure execution, and enjoy tight spreads from 0.5 pts on FX and 0.3 pts on indices.
Economic calendar
Web Trader platform
Our sophisticated web-based platform is packed with features.
Related articles

Australian Dollar Outlook: AUD/USD Retraces Ahead of Jobs, Trump–Xi Summit
AUD/USD outlook ahead of Australian employment, RBA speakers and the Trump–Xi summit as the Aussie extends its two-week retracement.


Australian Dollar Outlook: AUD/USD Rally Stalls as Fed Risk Returns
AUD/USD momentum fades as Fed hike expectations return, while RBA officials keep September tightening risks firmly in focus.

ASX 200 Eyes Break of 8900 as Sector Weakness Builds
ASX 200 bears eye a break of 8900 as sector weakness, options positioning and rising RBA hike expectations keep downside risks in focus.
This report is intended for general circulation only. It should not be construed as a recommendation, or an offer (or solicitation of an offer) to buy or sell any financial products. The information provided does not take into account your specific investment objectives, financial situation or particular needs. Before you act on any recommendation that may be contained in this report, independent advice ought to be sought from a financial adviser regarding the suitability of the investment product, taking into account your specific investment objectives, financial situation or particular needs.
StoneX Financial Pte. Ltd., may distribute reports produced by its respective foreign entities or affiliates within the StoneX group of companies or third parties pursuant to an arrangement under Regulation 32C of the Financial Advisers Regulations. Where the report is distributed to a person in Singapore who is not an accredited investor, expert investor or an institutional investor (as defined in the Securities Futures Act), StoneX Financial Pte. Ltd. accepts legal responsibility to such persons for the contents of the report only to the extent required by law. Singapore recipients should contact StoneX Financial Pte. Ltd. at 6826 9988 for matters arising from, or in connection with the report.
In the case of all other recipients of this report, to the extent permitted by applicable laws and regulations neither StoneX Financial Pte. Ltd. nor its associated companies will be responsible or liable for any loss or damage incurred arising out of, or in connection with, any use of the information contained in this report and all such liability is hereby expressly disclaimed. No representation or warranty is made, express or implied, that the content of this report is complete or accurate.
StoneX Financial Pte. Ltd. is not under any obligation to update this report.
Trading CFDs carries a high level of risk that may not be suitable for some investors. Consider your investment objectives, level of experience, financial resources, risk appetite and other relevant circumstances carefully. The possibility exists that you could lose some or all of your investments, including your initial deposits. If in doubt, please seek independent expert advice. Visit www.forex.com/en-sg/terms-and-policies for the complete Risk Disclosure Statement.