





Nasdaq 100 analysis: NDX retests key 12,900 level
A bullish bias remains appropriate with the Nasdaq 100 still above the key 12,900 level, but any more weakness would call that optimistic outlook into question
Share this:

Nasdaq 100 takeaways
- Last week’s big breakout in the Nasdaq 100 is facing its first major test
- The “Big 7” stocks that make up more than 50% of its weight are underperforming the broader index
- Bullish bias remains intact for now, but economic data will be key
Last week, we discussed the big breakout above 12,900 in the Nasdaq 100 and concluded that “only a reversal back below this week’s lows near 12,500 would erase the near-term bullish bias in the Nasdaq 100.”
Now, a week on, that bullish bias is facing its first big test.
The tech-heavy index rallied as high as 13,200 yesterday, but fears about a slowing US economy on the back of soft JOLTS, ADP, and ISM Services PMI figures have traders questioning whether instability in the banking system and the delayed impact of interest rate hikes over the last year could tip the economy into recession.
Even more than other indices, the Nasdaq 100 is very top-heavy, with the majority of the index’s weighting in just seven “Big Tech” names. As the chart below shows, outside of Alphabet (GOOG and GOOGL), all of these behemoths are underperforming the index’s -1.0% move today as we go to press:
Source: Slickcharts
Nasdaq 100 technical analysis: US TECH 100 daily chart
Source: StoneX, TradingView. Please note this product may not be available in all regions.
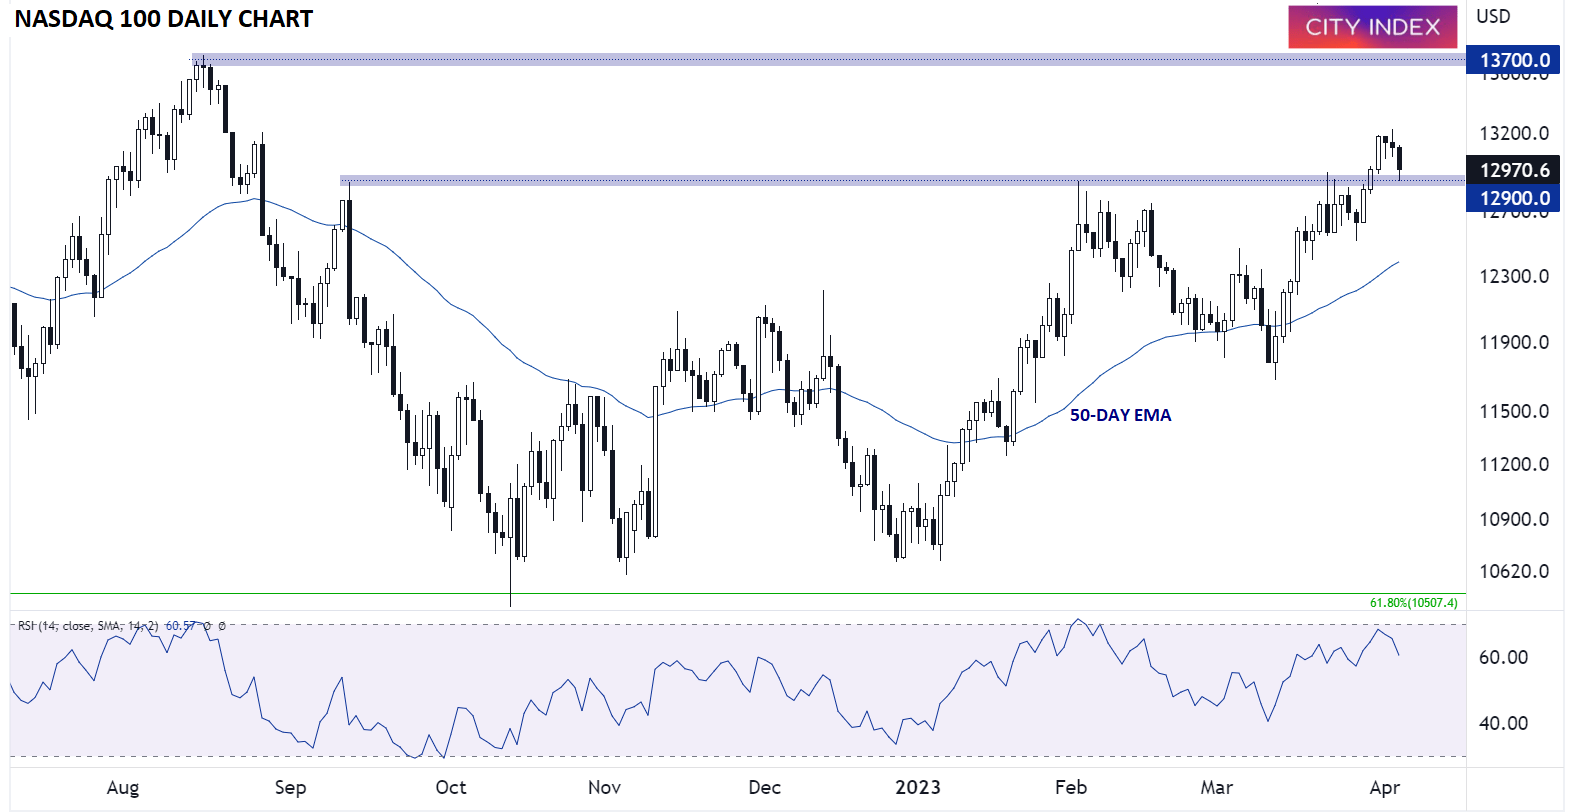
Looking at the chart above, the index has retraced back to the key 12,900 level. As many experienced traders know, breakouts have a tendency to revisit the proverbial “scene of the crime;” in other words, the Nasdaq 100 has retraced back to its initial breakout level, and it now remains to be seen if that previous resistance level will become support moving forward.
For now, a bullish bias remains appropriate with the index still above the key 12,900 level, but any more weakness, especially on the back of soft economic data in the coming days, would call that optimistic outlook into question.
-- Written by Matt Weller, Global Head of Research
Follow Matt on Twitter @MWellerFX
Nasdaq 100 takeaways
- Last week’s big breakout in the Nasdaq 100 is facing its first major test
- The “Big 7” stocks that make up more than 50% of its weight are underperforming the broader index
- Bullish bias remains intact for now, but economic data will be key
Last week, we discussed the big breakout above 12,900 in the Nasdaq 100 and concluded that “only a reversal back below this week’s lows near 12,500 would erase the near-term bullish bias in the Nasdaq 100.”
Now, a week on, that bullish bias is facing its first big test.
The tech-heavy index rallied as high as 13,200 yesterday, but fears about a slowing US economy on the back of soft JOLTS, ADP, and ISM Services PMI figures have traders questioning whether instability in the banking system and the delayed impact of interest rate hikes over the last year could tip the economy into recession.
Even more than other indices, the Nasdaq 100 is very top-heavy, with the majority of the index’s weighting in just seven “Big Tech” names. As the chart below shows, outside of Alphabet (GOOG and GOOGL), all of these behemoths are underperforming the index’s -1.0% move today as we go to press:
Source: Slickcharts
Nasdaq 100 technical analysis: US TECH 100 daily chart
Source: StoneX, TradingView. Please note this product may not be available in all regions.
Looking at the chart above, the index has retraced back to the key 12,900 level. As many experienced traders know, breakouts have a tendency to revisit the proverbial “scene of the crime;” in other words, the Nasdaq 100 has retraced back to its initial breakout level, and it now remains to be seen if that previous resistance level will become support moving forward.
For now, a bullish bias remains appropriate with the index still above the key 12,900 level, but any more weakness, especially on the back of soft economic data in the coming days, would call that optimistic outlook into question.
-- Written by Matt Weller, Global Head of Research
Follow Matt on Twitter @MWellerFX
How to trade with City Index
You can trade with City Index by following these four easy steps:
- Open an account, or log in if you’re already a customer
• Open an account in the UK
• Open an account in Australia
• Open an account in Singapore
- Search for the market you want to trade in our award-winning platform
- Choose your position and size, and your stop and limit levels
- Place the trade
Related tags:




Open an account in minutes
Experience award-winning platforms with fast and secure execution, and enjoy tight spreads from 0.5 pts on FX and 0.3 pts on indices.
Economic calendar
Web Trader platform
Our sophisticated web-based platform is packed with features.
Related articles
Nasdaq 100 Forecast: NDX falls as oil jumps and Treasury yields rise
U.S. stocks are pointing to a weaker open on Monday after President Trump rejected an Iranian ceasefire, sending oil prices higher and fuelling inflationary concerns and pushing Treasury yields higher.

S&P 500, Nasdaq, Dow Forecast: Wall Street Split Widens Into Month-End 9 26 2026
Nasdaq strength contrasts with mounting Dow pressure as rising Treasury yields raise the stakes for stocks heading into the monthly close.


Equity Indices Q4, 2026 Outlook: Cracks Begin to Show
There's still an open door for a melt-up in the S&P 500 and Nasdaq but the Dow and Russell 2000 are looking more vulnerable, and until calm hits the Treasuries market there's a higher probability for volatility. The big question is whether that's a next quarter theme or not.

This report is intended for general circulation only. It should not be construed as a recommendation, or an offer (or solicitation of an offer) to buy or sell any financial products. The information provided does not take into account your specific investment objectives, financial situation or particular needs. Before you act on any recommendation that may be contained in this report, independent advice ought to be sought from a financial adviser regarding the suitability of the investment product, taking into account your specific investment objectives, financial situation or particular needs.
StoneX Financial Pte. Ltd., may distribute reports produced by its respective foreign entities or affiliates within the StoneX group of companies or third parties pursuant to an arrangement under Regulation 32C of the Financial Advisers Regulations. Where the report is distributed to a person in Singapore who is not an accredited investor, expert investor or an institutional investor (as defined in the Securities Futures Act), StoneX Financial Pte. Ltd. accepts legal responsibility to such persons for the contents of the report only to the extent required by law. Singapore recipients should contact StoneX Financial Pte. Ltd. at 6826 9988 for matters arising from, or in connection with the report.
In the case of all other recipients of this report, to the extent permitted by applicable laws and regulations neither StoneX Financial Pte. Ltd. nor its associated companies will be responsible or liable for any loss or damage incurred arising out of, or in connection with, any use of the information contained in this report and all such liability is hereby expressly disclaimed. No representation or warranty is made, express or implied, that the content of this report is complete or accurate.
StoneX Financial Pte. Ltd. is not under any obligation to update this report.
Trading CFDs carries a high level of risk that may not be suitable for some investors. Consider your investment objectives, level of experience, financial resources, risk appetite and other relevant circumstances carefully. The possibility exists that you could lose some or all of your investments, including your initial deposits. If in doubt, please seek independent expert advice. Visit www.forex.com/en-sg/terms-and-policies for the complete Risk Disclosure Statement.