




Nasdaq 100 index analysis: NDX continues to coil in a bullish flag
The Nasdaq 100 price action off the mid-March low looks like a “bullish flag” pattern showing consolidation after a strong bullish move...
Share this:
Nasdaq 100 takeaways
- Following the “calm before the (earnings) storm,” volatility in the Nasdaq 100 should pick up by mid-week.
- The macroeconomic outlook remains solid, keeping the Fed on track to hike rates once more in two weeks.
- The bullish flag pattern over the last month points to a potentially strong bullish continuation if the index can break above 13,200.
With Q1 earnings season kicking off in earnest this week, we’re at the end of the proverbial “calm before the storm” for the Nasdaq 100. Two of the higher-weighted stocks in the index, Netflix (tomorrow) and Tesla (Wednesday) will report in the next 48 hours, with other heavy hitters like Microsoft, Alphabet, Amazon, and Meta on tap for next week and Apple hitting the wires on May 4th.
From a macroeconomic perspective, the US economy is holding up relatively well, with clear evidence that inflation is falling, the economy continues to grow at a solid rate, and the labor market still historically robust, despite some recent signs of softening. At this point, the biggest concerns for index investors are around a potential contraction in bank lending (especially at smaller regional banks) and the persistent inversion of the yield curve, an historically reliable recession indicator that is suggesting the Federal Reserve may have to start cutting interest rates in the second half of the year.
Nasdaq 100 technical analysis: NDX coiling above 12,900
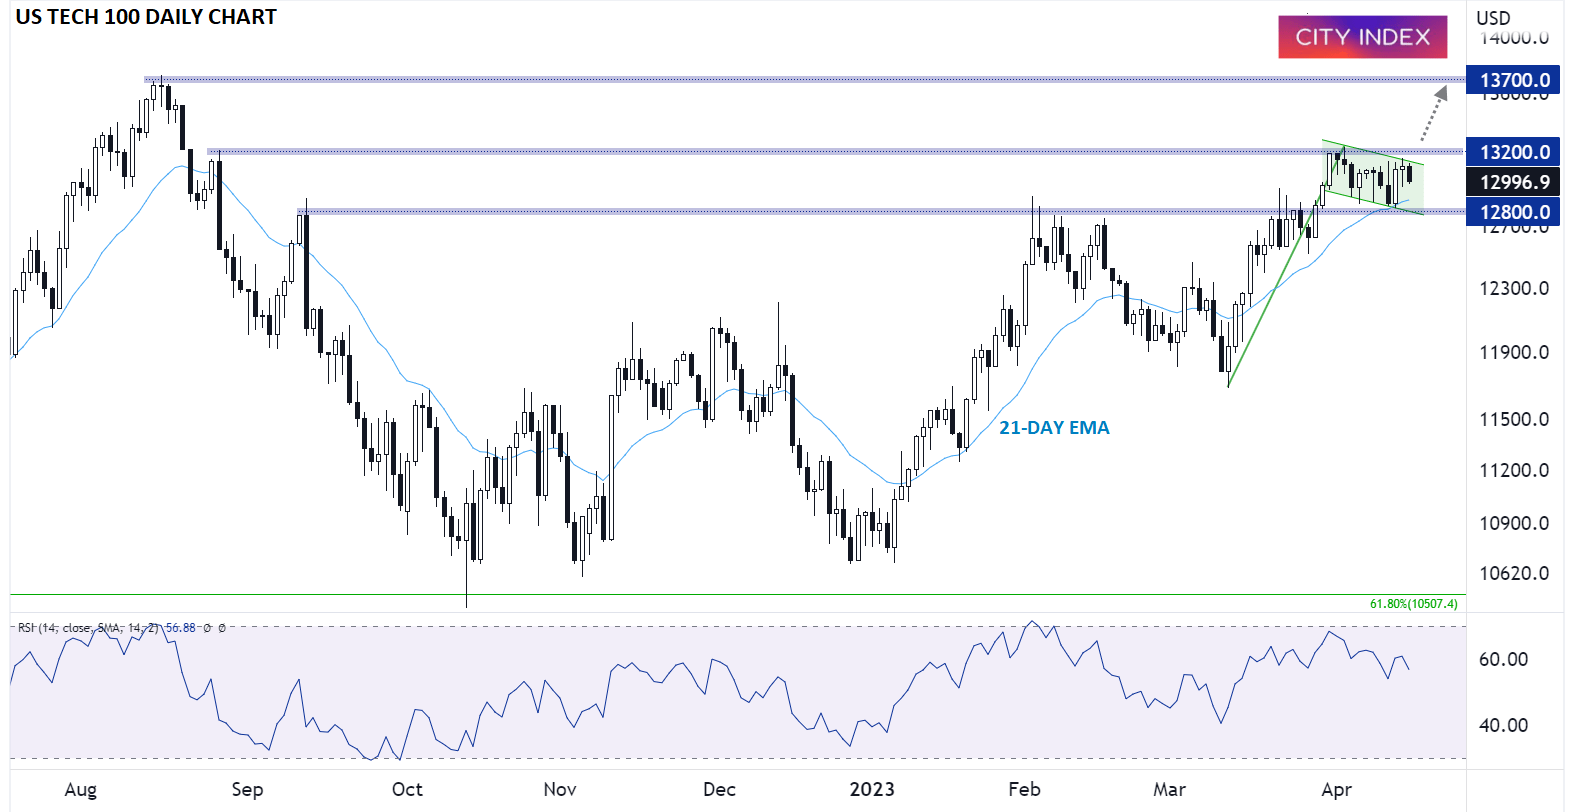
From a technical perspective, the tech-heavy index has spent the last two weeks consolidating in a tight range around 13,000 after breaking out to 7-month highs late last month. Looking at the chart, the price action off the mid-March low looks like a “bullish flag” pattern, showing consolidation after a strong bullish move; if confirmed by a breakout above 13,200, this pattern would point to a strong bullish continuation toward previous resistance at 13,700 if not higher as we head into summer.
Source: TradingView, StoneX
While not the most likely scenario at the moment, a sustained bearish break back below 12,900 would point to a deteriorating outlook, especially if accompanied by poor earnings reports from the highly weighted Big Tech behemoths, and could portend a fall back toward the lower-12,000s.
-- Written by Matt Weller, Global Head of Research
Follow Matt on Twitter @MWellerFX
Nasdaq 100 takeaways
- Following the “calm before the (earnings) storm,” volatility in the Nasdaq 100 should pick up by mid-week.
- The macroeconomic outlook remains solid, keeping the Fed on track to hike rates once more in two weeks.
- The bullish flag pattern over the last month points to a potentially strong bullish continuation if the index can break above 13,200.
With Q1 earnings season kicking off in earnest this week, we’re at the end of the proverbial “calm before the storm” for the Nasdaq 100. Two of the higher-weighted stocks in the index, Netflix (tomorrow) and Tesla (Wednesday) will report in the next 48 hours, with other heavy hitters like Microsoft, Alphabet, Amazon, and Meta on tap for next week and Apple hitting the wires on May 4th.
From a macroeconomic perspective, the US economy is holding up relatively well, with clear evidence that inflation is falling, the economy continues to grow at a solid rate, and the labor market still historically robust, despite some recent signs of softening. At this point, the biggest concerns for index investors are around a potential contraction in bank lending (especially at smaller regional banks) and the persistent inversion of the yield curve, an historically reliable recession indicator that is suggesting the Federal Reserve may have to start cutting interest rates in the second half of the year.
Nasdaq 100 technical analysis: NDX coiling above 12,900
From a technical perspective, the tech-heavy index has spent the last two weeks consolidating in a tight range around 13,000 after breaking out to 7-month highs late last month. Looking at the chart, the price action off the mid-March low looks like a “bullish flag” pattern, showing consolidation after a strong bullish move; if confirmed by a breakout above 13,200, this pattern would point to a strong bullish continuation toward previous resistance at 13,700 if not higher as we head into summer.
Source: TradingView, StoneX
While not the most likely scenario at the moment, a sustained bearish break back below 12,900 would point to a deteriorating outlook, especially if accompanied by poor earnings reports from the highly weighted Big Tech behemoths, and could portend a fall back toward the lower-12,000s.
-- Written by Matt Weller, Global Head of Research
Follow Matt on Twitter @MWellerFX
How to trade with City Index
You can trade with City Index by following these four easy steps:
- Open an account, or log in if you’re already a customer
• Open an account in the UK
• Open an account in Australia
• Open an account in Singapore
- Search for the market you want to trade in our award-winning platform
- Choose your position and size, and your stop and limit levels
- Place the trade
Related tags:


Open an account in minutes
Experience award-winning platforms with fast and secure execution, and enjoy tight spreads from 0.5 pts on FX and 0.3 pts on indices.
Economic calendar
Web Trader platform
Our sophisticated web-based platform is packed with features.
Related articles

Nikkei breakout accelerates as yen weakness returns
Nikkei has started October with a powerful breakout, helped by renewed yen weakness and strong upside momentum


AUD/USD hammered by US yields and fading RBA hike bets
US yields, dollar strength and fading RBA hike bets have combined to drive AUD/USD to fresh multi-month lows. The macro and technical bias remains bearish, although history suggests parts of the move are now reaching unusually stretched levels.

Canadian Dollar Forecast: USD/CAD Four-Week Rally Eyes Yearly Highs 9 30 2026
USD/CAD has advanced in 14 of the past 15 sessions, but stretched momentum raises the stakes as major resistance and NFP come into focus.

This report is intended for general circulation only. It should not be construed as a recommendation, or an offer (or solicitation of an offer) to buy or sell any financial products. The information provided does not take into account your specific investment objectives, financial situation or particular needs. Before you act on any recommendation that may be contained in this report, independent advice ought to be sought from a financial adviser regarding the suitability of the investment product, taking into account your specific investment objectives, financial situation or particular needs.
StoneX Financial Pte. Ltd., may distribute reports produced by its respective foreign entities or affiliates within the StoneX group of companies or third parties pursuant to an arrangement under Regulation 32C of the Financial Advisers Regulations. Where the report is distributed to a person in Singapore who is not an accredited investor, expert investor or an institutional investor (as defined in the Securities Futures Act), StoneX Financial Pte. Ltd. accepts legal responsibility to such persons for the contents of the report only to the extent required by law. Singapore recipients should contact StoneX Financial Pte. Ltd. at 6826 9988 for matters arising from, or in connection with the report.
In the case of all other recipients of this report, to the extent permitted by applicable laws and regulations neither StoneX Financial Pte. Ltd. nor its associated companies will be responsible or liable for any loss or damage incurred arising out of, or in connection with, any use of the information contained in this report and all such liability is hereby expressly disclaimed. No representation or warranty is made, express or implied, that the content of this report is complete or accurate.
StoneX Financial Pte. Ltd. is not under any obligation to update this report.
Trading CFDs carries a high level of risk that may not be suitable for some investors. Consider your investment objectives, level of experience, financial resources, risk appetite and other relevant circumstances carefully. The possibility exists that you could lose some or all of your investments, including your initial deposits. If in doubt, please seek independent expert advice. Visit www.forex.com/en-sg/terms-and-policies for the complete Risk Disclosure Statement.