



Nasdaq 100 outlook: Can tech stocks resume higher?
US Index futures fell back overnight, taking direction from a drop in European shares where a number of stocks were hit following their earnings results. In the US, we saw a decent recovery in the dollar yesterday following the release of mostly positive data and as minutes of the FOMC’s January meeting revealed policymakers were worried over inflation again, striking a slightly firmer tone on inflation.
Share this:
US Index futures fell back overnight, taking direction from a drop in European shares where a number of stocks were hit following their earnings results. In the US, we saw a decent recovery in the dollar yesterday following the release of mostly positive data and as minutes of the FOMC’s January meeting revealed policymakers were worried over inflation again, striking a slightly firmer tone on inflation. That may explain why we have seen stocks ease back as the chances of a sooner rate cut have been trimmed. Still, the underlying trend is bullish for US and global stocks. For us, the Nasdaq 100 outlook will only turn bearish if and when we start to see some lower lows and lower highs in the charts. While US indices have underperformed Europe so far this year, that doesn’t mean the bullish trend is over. But recent signs of strength in technology names means we could see the Nasdaq finally join the rally soon.
Before discussing macro trends further, let discuss some key levels on the chart of the Nasdaq 100.
Technical Nasdaq 100 outlook: Neutral for now
While there has been a lot of talk about the AI bubble bursting, and we have seen a few tech names underperform this year, this hasn’t been reflected in the Nasdaq breaking any major support levels.
Instead, the index has managed to hold above key support levels that previously triggered sharp rallies, particularly the 24,400 zone. This area has been technically significant in the past. Each time price has tested it, we’ve seen a strong rebound. The last one on 6th February, was particularly interesting, when the index rallied sharply from this region, forming a bullish engulfing candle. Since then, upside momentum has been more measured. We saw a modest push higher, but that momentum faded relatively quickly. The market then pulled back, yet importantly, it did not take out the low of that bullish engulfing candle.
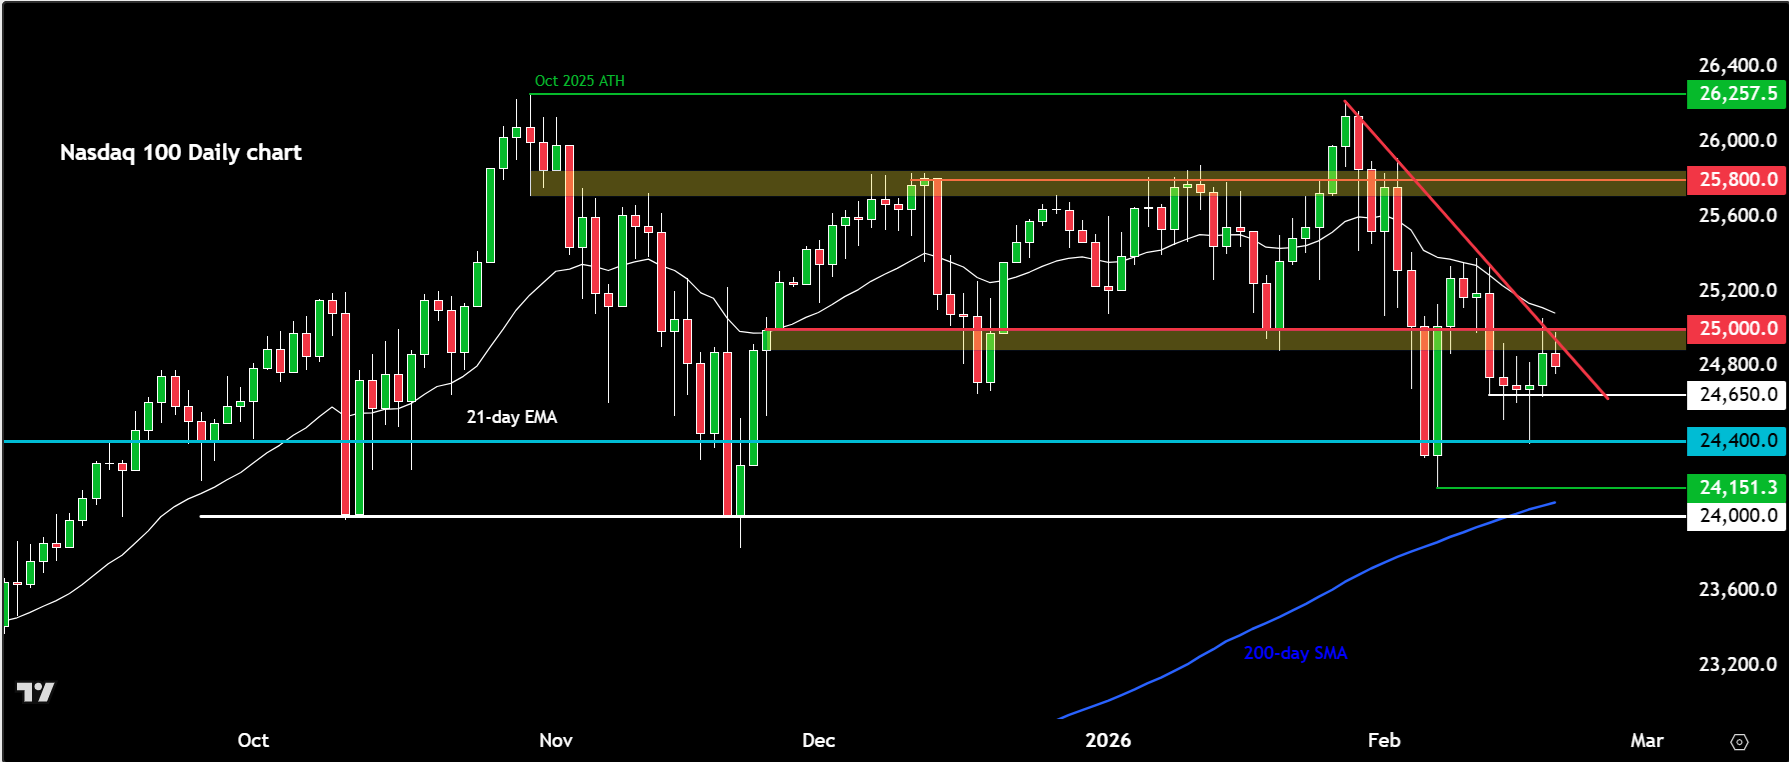
As a result, our US Tech 100 index, based on the underlying Nasdaq 100 futures, still looks constructive from a technical standpoint, but needs a nudge to start a trend. For example, a potential break above the descending trendline and resistance near 25,000 would reinforce the bullish case. If that occurs, we could see follow-through technical buying momentum in the days ahead.
So, the key resistance level to watch is 25,000, which was tested yesterday and held. This level corresponds to the low of a previous candle that was broken to the downside last Thursday. If price can reclaim and close above 25,000 on a daily basis, that would be another positive technical signal.
On the downside, near-term support is around 24,650. This level now needs to hold in order to maintain the short-term bullish structure and sustain the upside momentum seen so far this week. Below that 24,400 will come back into focus again.
Will stocks find support and will the dollar recovery hold?
As mentioned, sentiment seems to have taken a slight hit from the FOMC minutes released yesterday. The minutes revealed that several Fed policymakers suggested the central bank may need to raise interest rates if inflation stays above their goal, and several participants would prefer a two-sided description of the future rate intentions to reflect that it could actually hike if inflation remained at above-target levels.
In recent days, we have seen some stronger US economic data which suggest that the downside risks to employment has lessened, thereby reducing the need for immediate rate cuts. We have also seen economic activity being relatively strong. That narrative will be tested again with today’s release of jobless claims, Philly Fed manufacturing index and pending homes sales. Friday’s PMI releases, which should offer a timely snapshot of momentum across the manufacturing and services sectors, will also be watched closely.
But so far, good news has not been good enough to raise severe doubts over further rate cuts and for that reason stocks have remained largely supported. That said, traders have pared their bets slightly on interest rate cuts, now seeing a reduction by July instead of June. Still, if inflation were to soften further, this could pave the way for a sooner cut or further rate cuts later in the year. This makes the core PCE release all the more important on Friday.
All told, we are slightly positive on the Nasdaq 100 outlook as things stand.


-- Written by Fawad Razaqzada, Market Analyst
Follow Fawad on Twitter @Trader_F_R
How to trade with City Index
You can trade with City Index by following these four easy steps:
- Open an account, or log in if you’re already a customer
• Open an account in the UK
• Open an account in Australia
• Open an account in Singapore
- Search for the company you want to trade in our award-winning platform
- Choose your position and size, and your stop and limit levels
- Place the trade
Related tags:




Open an account in minutes
Experience award-winning platforms with fast and secure execution, and enjoy tight spreads from 0.5 pts on FX and 0.3 pts on indices.
Economic calendar
Web Trader platform
Our sophisticated web-based platform is packed with features.
Related articles

AUD/USD outlook: Aussie slips despite hawkish RBA ahead of key data
The AUD/USD was unable to benefit from the Reserve Bank of Australia’s 25-basis-point rate hike overnight. The RBA lifted the cash rate to 4.60%, in line with expectations. However, the Australian dollar weakened following the decision, with much of the Bank’s hawkish stance seemingly priced in ahead of the announcement. The US dollar has also remained largely supported following the recent turmoil in the bond markets.

RBA delivers 25bp hike, Bullock now the main event
The RBA delivered the expected 25bp hike, but Bullock’s press conference now looms as the bigger volatility risk for AUD/USD and the ASX 200.


Gold outlook: XAU/USD hammered, stretched and vulnerable to a sharp rebound
Gold is getting hammered for solid fundamental reasons, but history suggests extreme four-hourly oversold conditions can produce violent countertrend rallies.
This report is intended for general circulation only. It should not be construed as a recommendation, or an offer (or solicitation of an offer) to buy or sell any financial products. The information provided does not take into account your specific investment objectives, financial situation or particular needs. Before you act on any recommendation that may be contained in this report, independent advice ought to be sought from a financial adviser regarding the suitability of the investment product, taking into account your specific investment objectives, financial situation or particular needs.
StoneX Financial Pte. Ltd., may distribute reports produced by its respective foreign entities or affiliates within the StoneX group of companies or third parties pursuant to an arrangement under Regulation 32C of the Financial Advisers Regulations. Where the report is distributed to a person in Singapore who is not an accredited investor, expert investor or an institutional investor (as defined in the Securities Futures Act), StoneX Financial Pte. Ltd. accepts legal responsibility to such persons for the contents of the report only to the extent required by law. Singapore recipients should contact StoneX Financial Pte. Ltd. at 6826 9988 for matters arising from, or in connection with the report.
In the case of all other recipients of this report, to the extent permitted by applicable laws and regulations neither StoneX Financial Pte. Ltd. nor its associated companies will be responsible or liable for any loss or damage incurred arising out of, or in connection with, any use of the information contained in this report and all such liability is hereby expressly disclaimed. No representation or warranty is made, express or implied, that the content of this report is complete or accurate.
StoneX Financial Pte. Ltd. is not under any obligation to update this report.
Trading CFDs carries a high level of risk that may not be suitable for some investors. Consider your investment objectives, level of experience, financial resources, risk appetite and other relevant circumstances carefully. The possibility exists that you could lose some or all of your investments, including your initial deposits. If in doubt, please seek independent expert advice. Visit www.forex.com/en-sg/terms-and-policies for the complete Risk Disclosure Statement.