





Nasdaq 100 technical analysis: Stocks stage oversold bounce
Welcome to another edition of Technical Tuesday, a weekly report where we highlight some of the most interesting markets that will hopefully appease technical analysts and traders alike. In this edition, we will get technical on the Nasdaq 100.
Share this:

Are dip-buyers back or is this the calm before the (resumption of) storm? Indices, metals, oil, FX majors and cryptocurrencies have all bounced back after Wall Street slumped Monday on fears over Trump's trade war. In this Nasdaq 100 technical analysis article, we will examine whether this is merely an oversold bounce or something more significant, highlight key levels to watch and discuss some potential trade ideas.
Welcome to another edition of Technical Tuesday, a weekly report where we highlight some of the most interesting markets that will hopefully appease technical analysts and traders alike. In this edition, we will get technical on the Nasdaq 100.
Nasdaq 100 Technical Analysis: Oversold Bounce or Trend Reversal?
One thing that has been quite clear all these years in this long-term bull market is that every time we have had a decent sell-off, dip-buyers have invariably stepped in and drove markets to new highs despite any macro concerns. Every single time we have heard cries of “this time it is different,” the bulls have prevailed, and bought the dip. Not even covid could hold the bulls back, let alone the unwinding of yen carry trades in 2024, or China’s sluggish recovery that caused local markets to tank last year, and before that the Russian invasion of Ukraine, or the bear market of 2022 when inflation surged and caused interest rates to shoot higher across the world (excluding Japan). Are we going to see yet another such recovery soon, or does the market want to go a little deeper before dip buyers emerge? That’s the key question, and one way to find clues is by looking at the charts. We already know why markets have slumped this time, namely trade war concerns, so let’s not regurgitate that.
Key Resistance and Support Levels to Watch
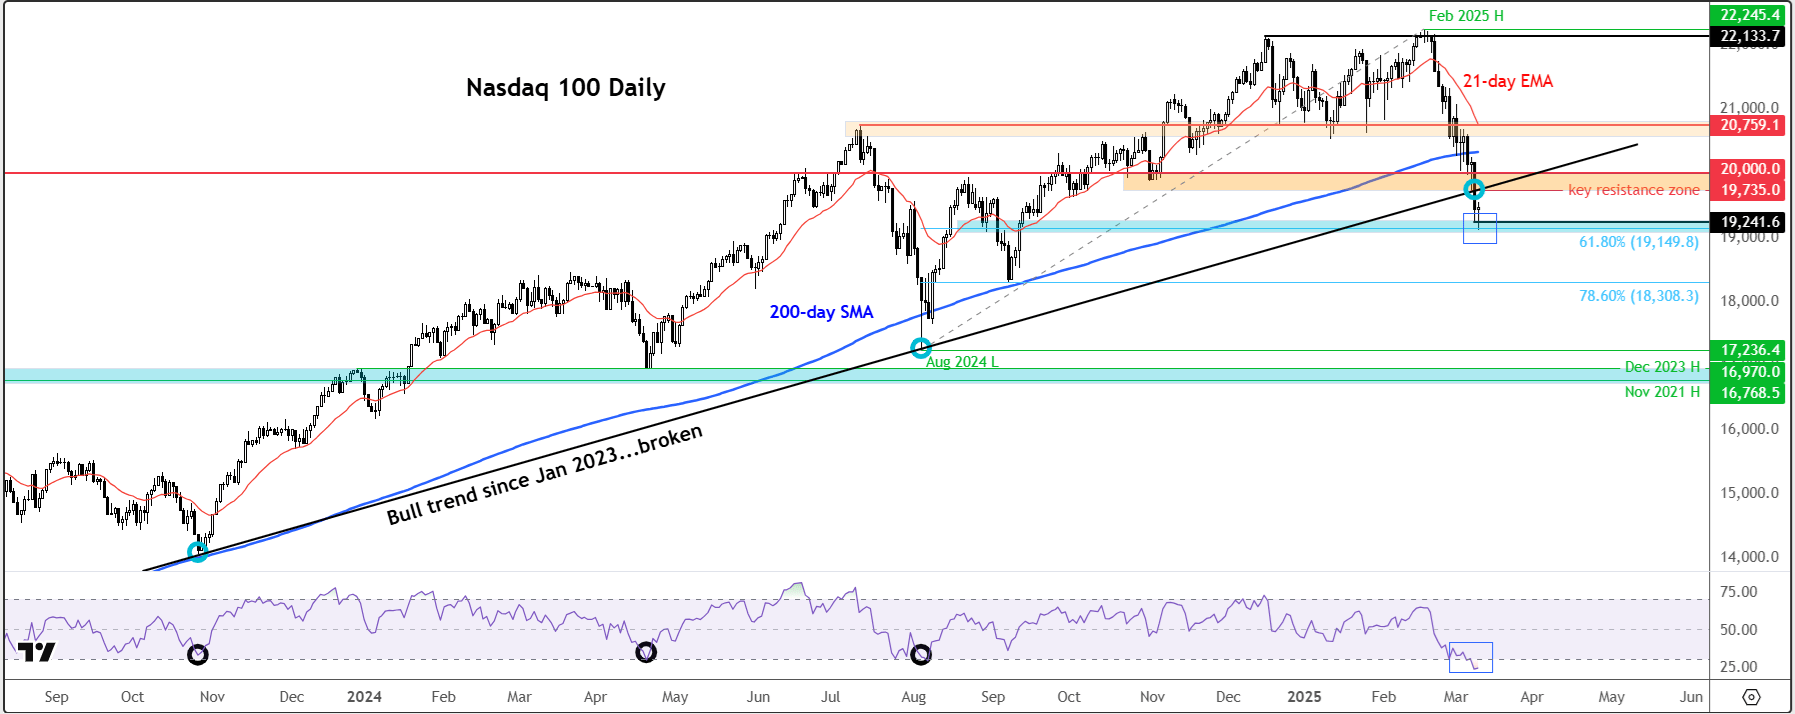
Regular readers might recall that I had been banging on about valuation concerns and technically overbought conditions before markets topped out in February. But this double-digit percentage drop in the Nasdaq 100 means both of those factors are now less of a concern. In fact, the Relative Strength Index (RSI) has not been this oversold at 25 since the bear market of 2022, when it plunged to 22 in January of that year. On a side note, the RSI was not at its extremist oversold levels when markets eventually bottomed then in October of that year. By the way, there is a lesson in this – i.e., even if we do see an oversold bounce here, this may not necessarily turn out to be THE bottom, which could take – as we saw in 2022 – months to form. And that’s not necessarily what I am looking for this time (a bear trend lasting months), but it is something that cannot be ruled out at this stage.
Source: TradingView.com
Anyway, as the chart shows, whenever the RSI has crossed below the 30 oversold threshold, we have invariably seen a bounce – and sometimes a major low. Thus, as a minimum, an oversold bounce to the nearest resistance is what I am looking for here. The nearest resistance is located at 19735, marking the low from Friday and the backside of the broken trend line that had been in place since January 2023. In fact, this level is the lower end of the key resistance range stretching to 20,000 level (shaded in orange colour on the chart).
They key support area to watch is around the 19,000-19,240 area. The lower end is the next psychologically-important level, while the middle i.e., 19150 level, marks the 61.8% Fibonacci retracement against the August-February rally, and the upper end marks the low from yesterday. We have already seen the index bounce from this zone, but a daily close above it would create a hammer-like candle, which could turn out to be significant. That being said, similar hammer looking candles, for example on Friday, and a few other ones during this correction, have failed to show bullish follow-through.
Will Dip Buyers Prevail Again?
So, if we do see a bounce into the close today, the key thing to then monitor is whether there will be any further upside follow-through, which has been missing every time we have seen recovery attempts during this correction phase. The key objective for the bulls will be to reclaim the broken trend line and thus move back above that 19735 level, and ideally 20,000, by the close of play today, or at a later point in time this week.
But until we see clear evidence of a bottom, traders must remain nimble and take things from one level to the next. Studying the charts and doing Nasdaq 100 technical analysis is always important if you trade the index, futures, ETFs or invest in induvial socks, but never ignore the fundamentals.
-- Written by Fawad Razaqzada, Market Analyst
Follow Fawad on Twitter @Trader_F_R
How to trade with City Index
You can trade with City Index by following these four easy steps:
- Open an account, or log in if you’re already a customer
• Open an account in the UK
• Open an account in Australia
• Open an account in Singapore
- Search for the company you want to trade in our award-winning platform
- Choose your position and size, and your stop and limit levels
- Place the trade
Latest market news




Open an account in minutes
Experience award-winning platforms with fast and secure execution, and enjoy tight spreads from 0.5 pts on FX and 0.3 pts on indices.
Economic calendar
Web Trader platform
Our sophisticated web-based platform is packed with features.
Related articles
EUR/USD Q4 2026 Outlook: Euro at a Crossroads as Fed, ECB Tighten 9 25 2026
EUR/USD enters Q4 at a pivotal inflection point as competing Fed-ECB policy paths and persistent inflation risks collide with major technical support.
USD/JPY Q4 2026 Outlook: Hawkish Fed Pricing Clashes With Intervention Risk
The year-end tug-of-war is clear: hawkish Fed pricing supports USD/JPY, while intervention risk limits the upside.


Japanese Yen Forecast: USD/JPY 4% Rally Challenges Post-Intervention Downtrend 9 24 2026
USD/JPY momentum has shifted sharply higher, putting a major resistance confluence in focus as U.S. and Japanese event risk builds.
This report is intended for general circulation only. It should not be construed as a recommendation, or an offer (or solicitation of an offer) to buy or sell any financial products. The information provided does not take into account your specific investment objectives, financial situation or particular needs. Before you act on any recommendation that may be contained in this report, independent advice ought to be sought from a financial adviser regarding the suitability of the investment product, taking into account your specific investment objectives, financial situation or particular needs.
StoneX Financial Pte. Ltd., may distribute reports produced by its respective foreign entities or affiliates within the StoneX group of companies or third parties pursuant to an arrangement under Regulation 32C of the Financial Advisers Regulations. Where the report is distributed to a person in Singapore who is not an accredited investor, expert investor or an institutional investor (as defined in the Securities Futures Act), StoneX Financial Pte. Ltd. accepts legal responsibility to such persons for the contents of the report only to the extent required by law. Singapore recipients should contact StoneX Financial Pte. Ltd. at 6826 9988 for matters arising from, or in connection with the report.
In the case of all other recipients of this report, to the extent permitted by applicable laws and regulations neither StoneX Financial Pte. Ltd. nor its associated companies will be responsible or liable for any loss or damage incurred arising out of, or in connection with, any use of the information contained in this report and all such liability is hereby expressly disclaimed. No representation or warranty is made, express or implied, that the content of this report is complete or accurate.
StoneX Financial Pte. Ltd. is not under any obligation to update this report.
Trading CFDs carries a high level of risk that may not be suitable for some investors. Consider your investment objectives, level of experience, financial resources, risk appetite and other relevant circumstances carefully. The possibility exists that you could lose some or all of your investments, including your initial deposits. If in doubt, please seek independent expert advice. Visit www.forex.com/en-sg/terms-and-policies for the complete Risk Disclosure Statement.