



noble capitulation 1851732017
<p>The fall of shares in Singapore’s largest trading firm extended to more than 50% for the week on Friday, after its chairman and founder stood down.</p>
Share this:

The fall of shares in Singapore’s largest trading firm extended to more than 50% for the week on Friday, after its chairman and founder stood down.
Bad timing to keep a promise
Richard Elman had in fact pledged, last June, to depart, within 12 months. That promise coincided with the group announcing a $500m rights issue aimed at reducing debt, which stood at $3.7bn at the end of March 2016. The embattled group, whose troubles stemmed from a broad collapse in commodities prices in 2014-2015, has since cut debt considerably. Net debt stood at $2.88bn at the end of last year. Other signs of improving financial strength include $2.4bn in cash and unused borrowing at the end of Q1 2017, and the paying-down of a $650m loan, leaving another $600m to repay later this year. Much of the financial capacity for these moves came from the disposal of its North American distribution business at the end of 2016.
Unfortunately, even assuming the $130m loss Noble reported in Q1 was a short-lived setback many facts accompanying it are alarming. It is a negative surprise for instance that the outgoing chairman only sees a return to sustainable profitability by 2018-2019. The trend of events had suggested Noble would mark a recovery sooner. In February the group reported a small annual profit after 2015’s $1.7bn loss, suggesting a turnaround after a torrid two years of tumbling prices compounded by governance and accounting concerns.
Enough liquidity (worry)
Elsewhere, whilst liquidity is currently sufficient, the group has reportedly delayed the renewal of a revolving credit line until June. It paid off the facility when it became due last week, according to a report by Bloomberg News, citing people familiar with matter. By deduction, it would appear the group is now dependant on higher-cost credit. Yields on its recently issued bonds have blown out around 1800 basis points (bp) this week to 27.082%. The cost of insuring Noble debt against default for five years (with a 5-year Credit Default Swap) is up 240bp to 993bp. That means the cost of insuring $10m worth of debt has surged $240,000 this week to $993,000 a year.
More fundamentally, the group blames its loss on a bad quarter in the coal market which undermined hedging. The risk that hedging strategies have hit a roadblock may suggest further quarterly losses ahead. There are also signs that investors are increasingly wary of exposure to the dirtiest fossil fuel. At the same time, there has been a clear revival of the market in other commodities like copper and zinc, both of which are higher year-to-year, after Noble said in 2015 that it would wind down its business in those metals.
The group’s claim that a “smaller, nimbler Noble” is emerging, with lower expenses, has merit. But the shortfall relative to that goal continues to represent the main risk to its ability to finance itself, and to its stock.
After two years of punishing short-selling attacks, which had recently abated, this week’s 56% crash to S$0.665—including a 32% tanking on Thursday, the shares’ biggest one-day fall—will tempt more bearish traders to return. The stock is now some 44% below the 2016 capital raising price. That suggests some cash call investors have closed out to avoid deeper losses. If so, the stock is now more vulnerable because there are fewer holders and more short-term traders.
Is this capitulation, or worse?
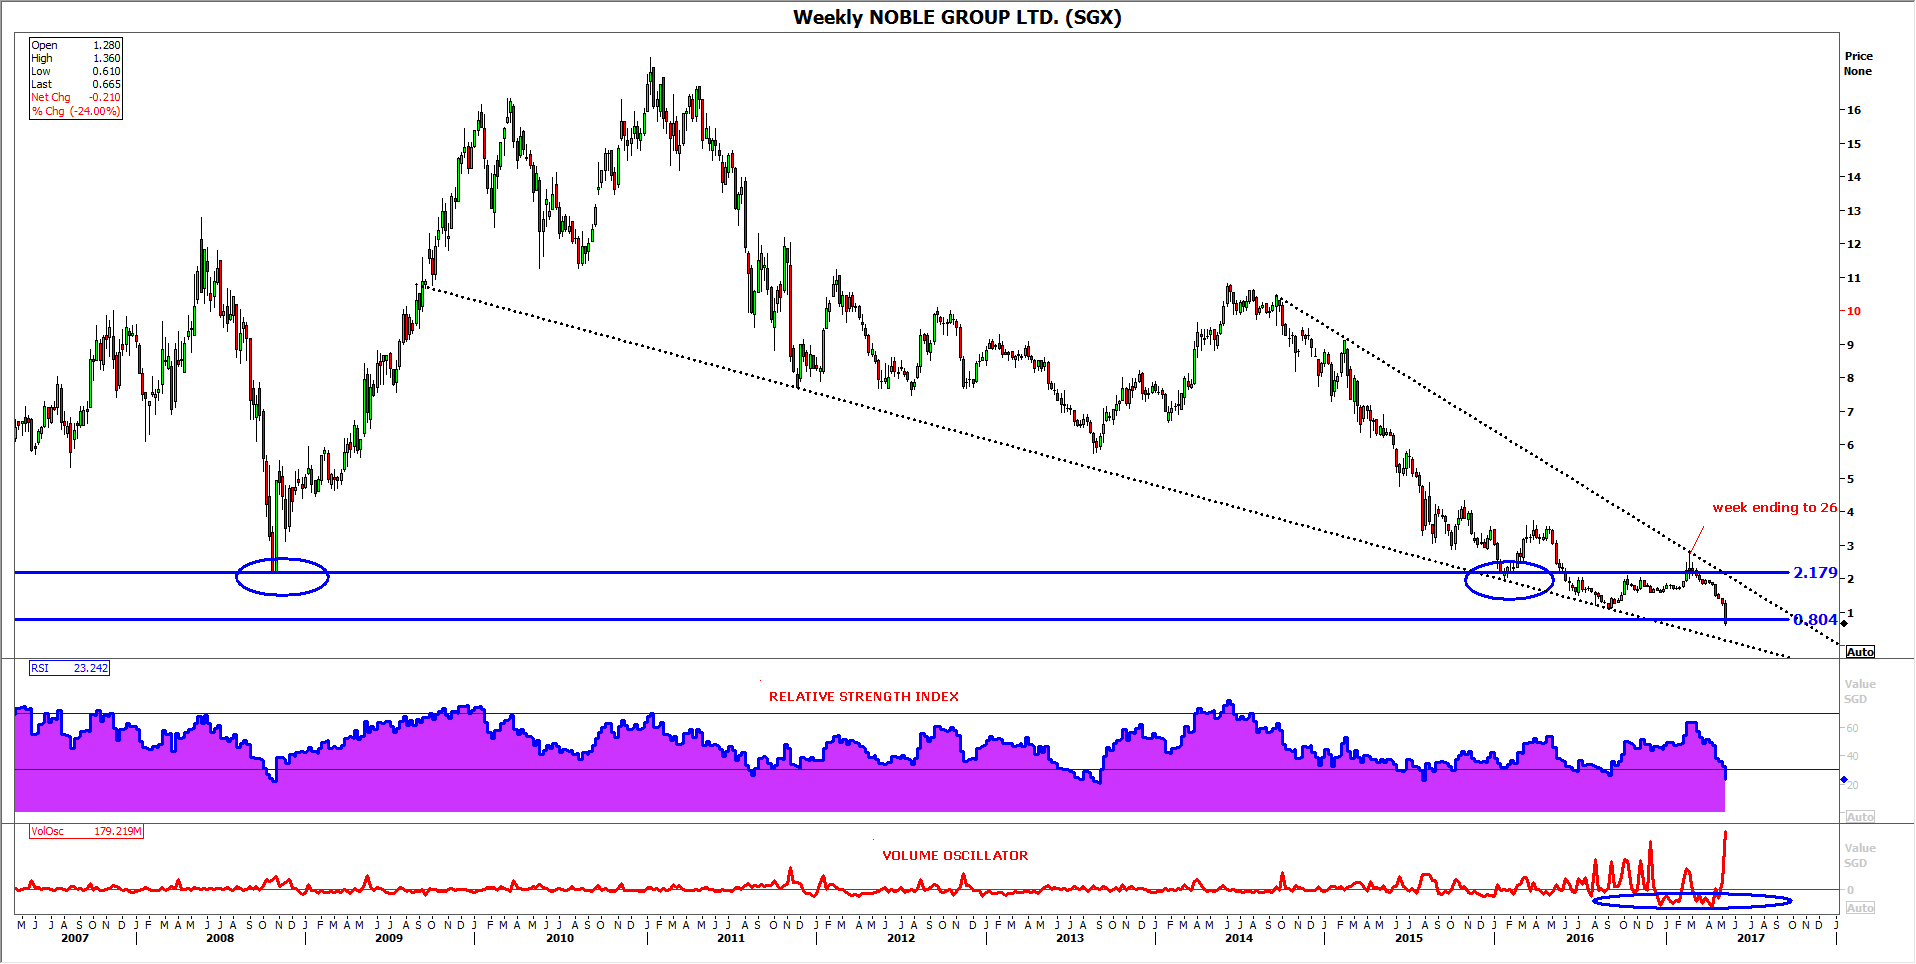
- The most striking aspect of Noble’s weekly technical chart, pictured, is the plunge into the abyss under S$2.179, its financial-crisis nadir, that finally gave way in March
- With the stock not having properly visited prices beneath the support for coming up to 14 years, it would appear that no further reliable support can credibly be called
- In fact though, the shares settled on Friday within a range seen between May-November 2002
- The fact that the stock has breached the line marking a possible lower bound of the range is not necessarily indicative of further declines, though probability suggests the downside will prevail for the short-to-medium term
- Just before this week’s near-parabolic volume vault, note the fall below trend in the volume oscillator sub-chart (bottom). It was suggestive of relative stability returning. The current ascent however backs the view that we are seeing ‘capitulation volumes’. Capitulation can have positive implications for shares, though more pain may be come first
- Moving to the primary pattern of this distressed stock, its downtrend may be erratic but still reveals a fairly classic descending wedge
- In a downtrend the wedge equates to a continuation pattern when the stock is making lower lows (like this week) and lower highs (as per week ending 26th February)
- Likely confirmation of the continuing declining impetus contradicts hopes that a capitulatory final washout has occurred, although the movement of the RSI oscillator nearer to the nominal ‘20’ ‘oversold’ value suggests that such a state may be close
- Failure of declines to abate soon and in particular, lack of energy to remount the lower bound of the S$2.179-S$0.804 ‘terminal support zone’ will show that gravity remains the strongest force on Noble shares for the time being
WEEKLY CHART: NOBLE GROUP LTD. (SGX)
Related tags:
Latest market news




Open an account in minutes
Experience award-winning platforms with fast and secure execution, and enjoy tight spreads from 0.5 pts on FX and 0.3 pts on indices.
Economic calendar
Web Trader platform
Our sophisticated web-based platform is packed with features.
Related articles
This report is intended for general circulation only. It should not be construed as a recommendation, or an offer (or solicitation of an offer) to buy or sell any financial products. The information provided does not take into account your specific investment objectives, financial situation or particular needs. Before you act on any recommendation that may be contained in this report, independent advice ought to be sought from a financial adviser regarding the suitability of the investment product, taking into account your specific investment objectives, financial situation or particular needs.
StoneX Financial Pte. Ltd., may distribute reports produced by its respective foreign entities or affiliates within the StoneX group of companies or third parties pursuant to an arrangement under Regulation 32C of the Financial Advisers Regulations. Where the report is distributed to a person in Singapore who is not an accredited investor, expert investor or an institutional investor (as defined in the Securities Futures Act), StoneX Financial Pte. Ltd. accepts legal responsibility to such persons for the contents of the report only to the extent required by law. Singapore recipients should contact StoneX Financial Pte. Ltd. at 6826 9988 for matters arising from, or in connection with the report.
In the case of all other recipients of this report, to the extent permitted by applicable laws and regulations neither StoneX Financial Pte. Ltd. nor its associated companies will be responsible or liable for any loss or damage incurred arising out of, or in connection with, any use of the information contained in this report and all such liability is hereby expressly disclaimed. No representation or warranty is made, express or implied, that the content of this report is complete or accurate.
StoneX Financial Pte. Ltd. is not under any obligation to update this report.
Trading CFDs carries a high level of risk that may not be suitable for some investors. Consider your investment objectives, level of experience, financial resources, risk appetite and other relevant circumstances carefully. The possibility exists that you could lose some or all of your investments, including your initial deposits. If in doubt, please seek independent expert advice. Visit www.forex.com/en-sg/terms-and-policies for the complete Risk Disclosure Statement.