



Oil, USD/JPY Forecast: Two trades to watch
Oil rises towards a 6-week high as tensions in the Middle East escalate. USD/JPY on intervention watch above 163.
Share this:

Oil rises towards a 6-week high as Middle East tensions escalate
Oil prices are extending gains towards a six-week high amid fears of further supply disruption after the U.S. and Iran exchanged fire for an 11th consecutive night. Meanwhile, oil tankers made U-turns in the Red Sea following warnings of disruption from Iran-backed Houthi forces.
The continued exchange of strikes between the U.S. and Iran has heightened concerns over further disruption to energy supplies. Despite talk of mediation earlier in the week, hostilities appear to be escalating rather than easing.
Adding to those concerns, the Iran-backed Houthis have opened a new front by threatening to target vessels carrying Saudi crude through the Bab el-Mandeb Strait. They have also announced a naval blockade of Saudi Arabia.
The Bab el-Mandeb has become an increasingly important route for Saudi crude exports as traffic through the Strait of Hormuz has declined sharply since the U.S.-Iran ceasefire collapsed. Three Saudi oil tankers reportedly made U-turns in the Red Sea yesterday.
Should the Bab el-Mandeb Strait also become inaccessible, tankers would be forced to reroute via the Suez Canal, adding both time and cost to shipments to Asia.
Oil forecast – technical analysis
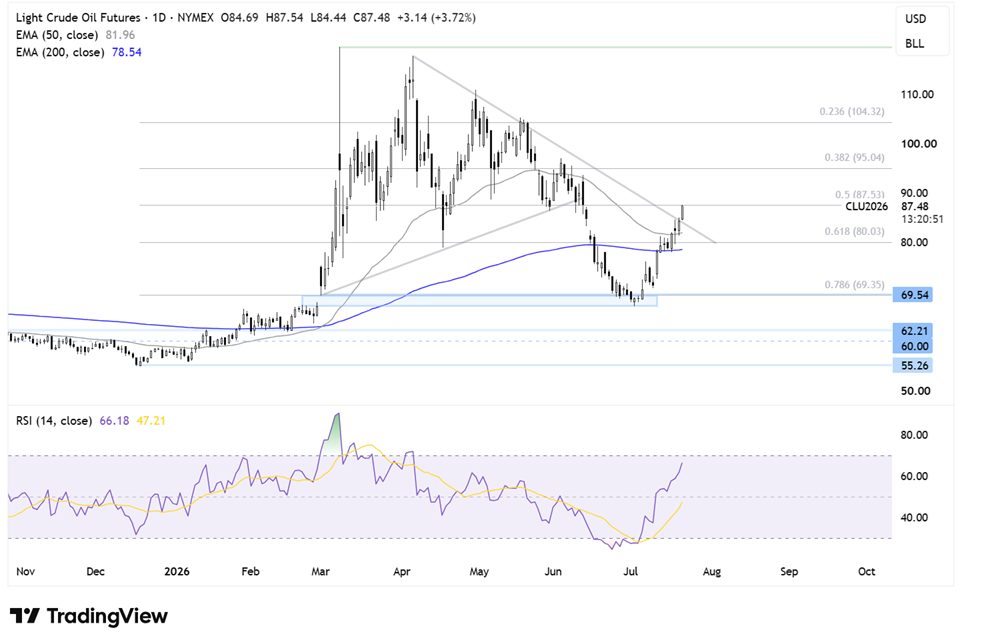
Oil broke above the symmetrical triangle pattern before running into resistance around $87. The price continues to trade above the 50-day and 200-day EMAs, as well as the rising trendline support. Combined with the RSI holding above 50, this keeps the near-term outlook constructive.
Buyers will look to break above $88, the 50% Fibonacci retracement of the $55–$120 move. A rise above here brings $95, the 38.2% Fibonacci retracement, into focus, ahead of the $100 psychological level.
Initial support can be seen at $84.50, ahead of the rising trendline, the 50-day EMA at $81.85, and $80, the 61.8% Fibonacci retracement.
Below there, support is seen around $78, where the 200-day EMA sits. A break below this level could see sellers gain traction towards $70.67, the July low.
USD/JPY on intervention watch above 163
USD/JPY has climbed to a fresh 40-year high above 163 as rising oil prices and higher U.S. Treasury yields continue to support the dollar, leaving investors increasingly nervous about the risk of Japanese intervention.
The dollar is finding support from safe-haven demand as the conflict in the Middle East continues.
At the same time, rising oil prices are adding to inflation concerns, helping push the benchmark 10-year Treasury yield to its highest level since May earlier this week.
However, the Japanese yen is failing to benefit from safe-haven demand given Japan's reliance on imported energy, making it particularly vulnerable when oil prices rise.
With the yen at its weakest level since 1986, markets remain on intervention watch after Japanese authorities stepped in during both April and May once USD/JPY moved above 160.
Previous intervention only slowed the move temporarily, with the underlying uptrend quickly reasserting itself.
With USD/JPY now trading above 163, the risk of another intervention is rising. However, while intervention can slow momentum, it rarely changes the broader trend unless it is backed by a more hawkish Bank of Japan and a less hawkish Federal Reserve.
For now, the wide interest rate differential continues to favour the dollar, making yen rallies attractive selling opportunities.
While the U.S. economic calendar is relatively quiet this week, attention will be on Friday's PMI data. In Japan, focus will turn to inflation figures released early Friday morning.
USD/JPY forecast – technical analysis
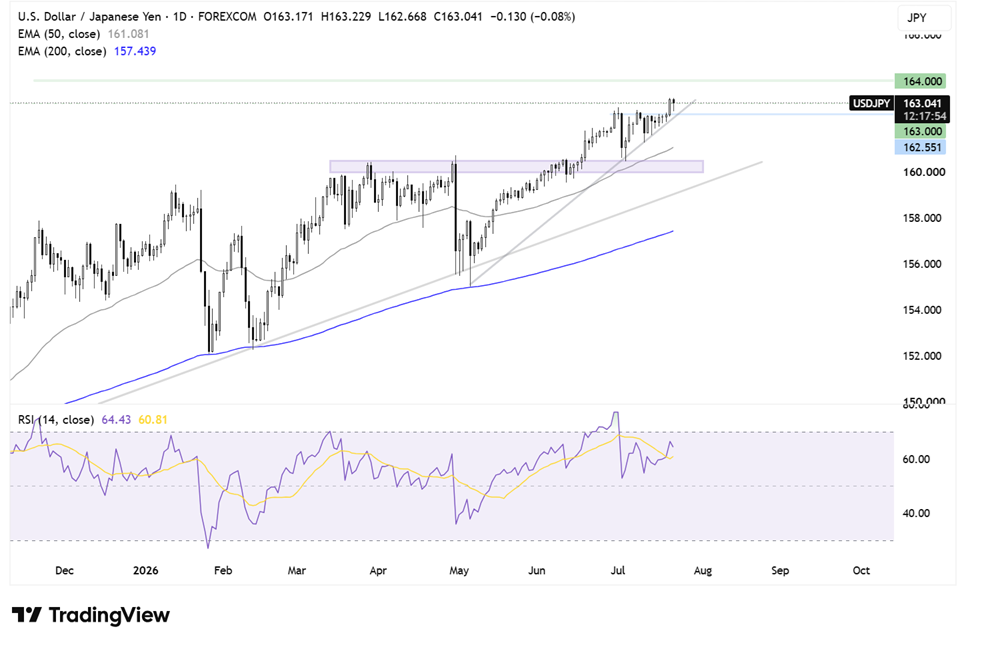
USD/JPY continues to extend its bullish run, trading above its rising trendline and both the 50-day and 200-day EMAs after climbing to 163.25.
However, momentum is beginning to slow, and the bearish RSI divergence suggests buyers should be a little more cautious.
Even so, buyers will look to extend gains towards 164.00, the next key psychological level.
On the downside, initial support can be be seen around 162.50. A break below here brings the 50-day SMA around 161.00 into focus before attention turns to the 160.00 support zone.
Related tags:
Latest market news




Open an account in minutes
Experience award-winning platforms with fast and secure execution, and enjoy tight spreads from 0.5 pts on FX and 0.3 pts on indices.
Economic calendar
Web Trader platform
Our sophisticated web-based platform is packed with features.
Related articles

S&P 500 Forecast: SPX rises after cooler-than-expected inflation data
U.S. stocks are rising and Treasury yields are falling after data showed that inflation increased at a cooler pace than expected, while U.S. consumer spending rose again in August.

Treasury Yields Lose Momentum as Energy ETF Retreats
The 10-year Treasury yield is testing a resistance zone respected since the 1920s, as bearish RSI divergence signals fading upside momentum.


GBP/USD, Oil Forecast: Two trades to watch 300926
GBP/USD: Can Stronger UK Growth Offset the Dollar’s Advantage? Oil: Supply Recovery Challenges the Geopolitical Premium.
This report is intended for general circulation only. It should not be construed as a recommendation, or an offer (or solicitation of an offer) to buy or sell any financial products. The information provided does not take into account your specific investment objectives, financial situation or particular needs. Before you act on any recommendation that may be contained in this report, independent advice ought to be sought from a financial adviser regarding the suitability of the investment product, taking into account your specific investment objectives, financial situation or particular needs.
StoneX Financial Pte. Ltd., may distribute reports produced by its respective foreign entities or affiliates within the StoneX group of companies or third parties pursuant to an arrangement under Regulation 32C of the Financial Advisers Regulations. Where the report is distributed to a person in Singapore who is not an accredited investor, expert investor or an institutional investor (as defined in the Securities Futures Act), StoneX Financial Pte. Ltd. accepts legal responsibility to such persons for the contents of the report only to the extent required by law. Singapore recipients should contact StoneX Financial Pte. Ltd. at 6826 9988 for matters arising from, or in connection with the report.
In the case of all other recipients of this report, to the extent permitted by applicable laws and regulations neither StoneX Financial Pte. Ltd. nor its associated companies will be responsible or liable for any loss or damage incurred arising out of, or in connection with, any use of the information contained in this report and all such liability is hereby expressly disclaimed. No representation or warranty is made, express or implied, that the content of this report is complete or accurate.
StoneX Financial Pte. Ltd. is not under any obligation to update this report.
Trading CFDs carries a high level of risk that may not be suitable for some investors. Consider your investment objectives, level of experience, financial resources, risk appetite and other relevant circumstances carefully. The possibility exists that you could lose some or all of your investments, including your initial deposits. If in doubt, please seek independent expert advice. Visit www.forex.com/en-sg/terms-and-policies for the complete Risk Disclosure Statement.