




Palladium Pulls Back Into Resistance
Palladium prices have pulled back into a resistance zone, making it appealing to bearish swing traders.
Share this:

Palladium prices have pulled back into a resistance zone, making it appealing to bearish swing traders.
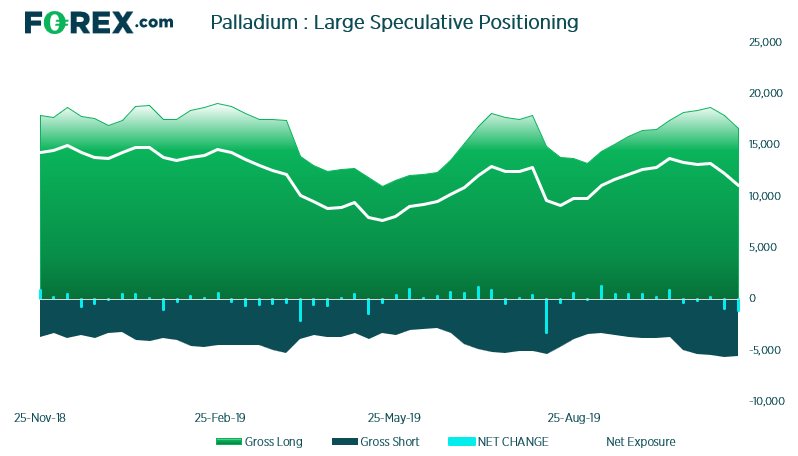
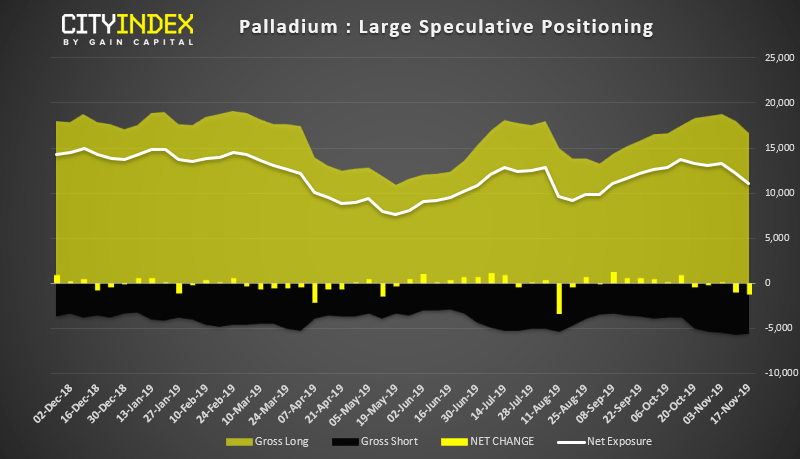
As mentioned in this week’s COT report, net-long exposure for Palladium has fallen to a 2-month low and we see potential for it to fall further, along with prices. According to Reuters polls, the median forecast for palladium prices in Q4 is 1620, and then for it to fall to 1495 by Q2, with the lowest forecast over this period falling to as low as 1200.
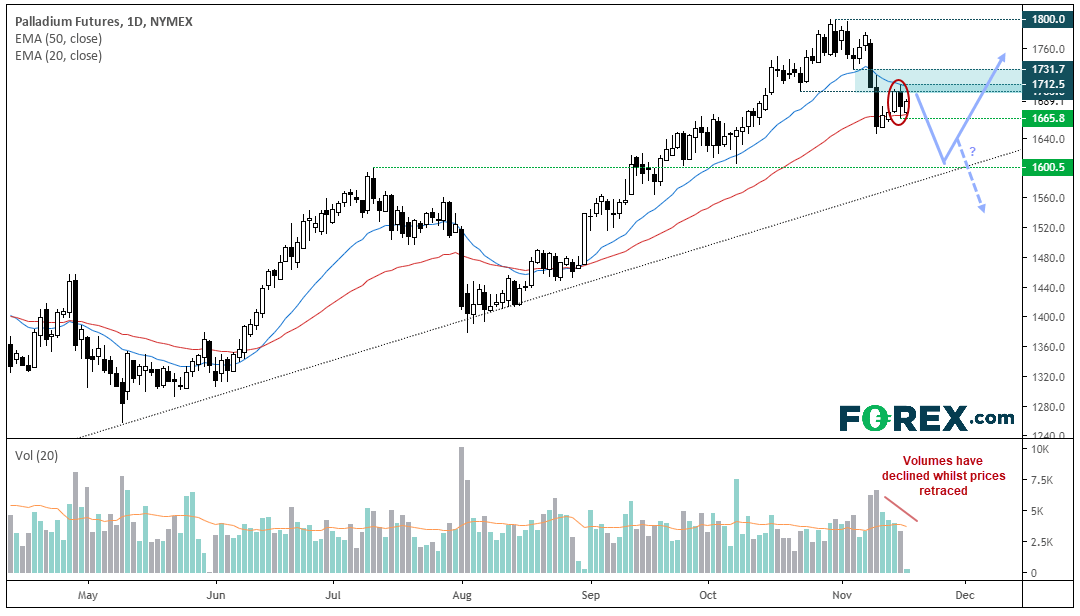
Prices have retraced to the 1700 low and formed a 2-bear reversal pattern on Friday (a dark cloud cover). Volumes have also depleted during this minor rebound, which points towards it being a retracement against bearish momentum and for prices to roll over for another leg lower. The 20-day eMA is capping as resistance, although we could also use the 1731.70 low to aid with risk management, given the 50-day eMA is providing support.
- Whilst the near-term bias is bearish, it’s still part of a long-term bull trend so we’re also looking for signs the current correction is over.
- Bears could look to fade into rallies beneath 1731.70. Alternatively, they could wait for a break beneath 1665.80, which then confirms the bearish reversal pattern (dark cloud cover). This also means the 50-day eMA would have been broken.
- The initial target is around 1600, near the July high. Although the bullish trendline could also act as support along the way, depending on how long this move takes to unfold.
- If the target is achieved, we can then reassess its potential to either extend losses or mark the end of a correction.
Related Analysis:
Did Palladium Fly Too Close To The Sun?
Gold’s Worst Week in 3 Years Sees Bears Firmly Back In Control
Gold drops to key support
Palladium prices have pulled back into a resistance zone, making it appealing to bearish swing traders.
As mentioned in this week’s COT report, net-long exposure for Palladium has fallen to a 2-month low and we see potential for it to fall further, along with prices. According to Reuters polls, the median forecast for palladium prices in Q4 is 1620, and then for it to fall to 1495 by Q2, with the lowest forecast over this period falling to as low as 1200.
Prices have retraced to the 1700 low and formed a 2-bear reversal pattern on Friday (a dark cloud cover). Volumes have also depleted during this minor rebound, which points towards it being a retracement against bearish momentum and for prices to roll over for another leg lower. The 20-day eMA is capping as resistance, although we could also use the 1731.70 low to aid with risk management, given the 50-day eMA is providing support.
- Whilst the near-term bias is bearish, it’s still part of a long-term bull trend so we’re also looking for signs the current correction is over.
- Bears could look to fade into rallies beneath 1731.70. Alternatively, they could wait for a break beneath 1665.80, which then confirms the bearish reversal pattern (dark cloud cover). This also means the 50-day eMA would have been broken.
- The initial target is around 1600, near the July high. Although the bullish trendline could also act as support along the way, depending on how long this move takes to unfold.
- If the target is achieved, we can then reassess its potential to either extend losses or mark the end of a correction.
Related Analysis:
Did Palladium Fly Too Close To The Sun?
Gold’s Worst Week in 3 Years Sees Bears Firmly Back In Control
Gold drops to key support
Related tags:
Latest market news




Open an account in minutes
Experience award-winning platforms with fast and secure execution, and enjoy tight spreads from 0.5 pts on FX and 0.3 pts on indices.
Economic calendar
Web Trader platform
Our sophisticated web-based platform is packed with features.
Related articles

WTI Crude Oil Mulls Bounce from $90
Having fallen 17% from its cycle highs in just five days and now holding above $90, perhaps it could be time for crude oil to bounce over the near term.


Gold, silver shrug off a brutal macro stress test
A hawkish Fed, surging short-dated Treasury yields and a firmer dollar failed to deliver the kind of damage usually seen in precious metals.


Gold Technical Outlook: XAU/USD Bulls Regroup at a Critical Pivot Ahead of Fed 9 16 2026
Gold is attempting to stabilize near a pivotal technical zone, with the Fed decision poised to provide the catalyst for the next major move.

This report is intended for general circulation only. It should not be construed as a recommendation, or an offer (or solicitation of an offer) to buy or sell any financial products. The information provided does not take into account your specific investment objectives, financial situation or particular needs. Before you act on any recommendation that may be contained in this report, independent advice ought to be sought from a financial adviser regarding the suitability of the investment product, taking into account your specific investment objectives, financial situation or particular needs.
StoneX Financial Pte. Ltd., may distribute reports produced by its respective foreign entities or affiliates within the StoneX group of companies or third parties pursuant to an arrangement under Regulation 32C of the Financial Advisers Regulations. Where the report is distributed to a person in Singapore who is not an accredited investor, expert investor or an institutional investor (as defined in the Securities Futures Act), StoneX Financial Pte. Ltd. accepts legal responsibility to such persons for the contents of the report only to the extent required by law. Singapore recipients should contact StoneX Financial Pte. Ltd. at 6826 9988 for matters arising from, or in connection with the report.
In the case of all other recipients of this report, to the extent permitted by applicable laws and regulations neither StoneX Financial Pte. Ltd. nor its associated companies will be responsible or liable for any loss or damage incurred arising out of, or in connection with, any use of the information contained in this report and all such liability is hereby expressly disclaimed. No representation or warranty is made, express or implied, that the content of this report is complete or accurate.
StoneX Financial Pte. Ltd. is not under any obligation to update this report.
Trading CFDs carries a high level of risk that may not be suitable for some investors. Consider your investment objectives, level of experience, financial resources, risk appetite and other relevant circumstances carefully. The possibility exists that you could lose some or all of your investments, including your initial deposits. If in doubt, please seek independent expert advice. Visit www.forex.com/en-sg/terms-and-policies for the complete Risk Disclosure Statement.