




S&P 500 Forecast: Cooling off from overbought levels
So far, US stock investors appear unfazed by global softness in commodities and bond markets, even as the 10-year Treasury yield inches closer to 4.5%, reflecting a more hawkish interest rate outlook for next year. But with the dust settling on Trump’s election victory, could we finally see retracement to cause a bearish shift in the short-term S&P 500 forecast?
Share this:

- S&P 500 forecast: Index holding post-election gains for now but overbought signals point to pullback
- Upcoming Fed Chair Powell’s comments may cause volatility
- Technical analysis suggests bullish trend intact with potential support areas for traders highlighted
After last week’s US election, where Trump’s win gave a boost to US markets, the S&P 500 has largely maintained its impressive rally, staying resilient despite significant global market volatility. But outside of the US and cryptos, investors have been far more cautious, owing to the potential impact of Trump’s trade plans and signs US monetary policy may not loosen significantly further in 2025. Today’s Producer Price Index (PPI) measure of inflation was a little hotter, adding to the Consumer Price Index (CPI) from the day before. Yet, the dollar, already sharply higher, was hit by some profit-taking after the release. US indices hardly reacted, but that could change as we head deeper into the US session. European markets rallied strongly earlier, led by the German DAX, while APAC stocks continued a bearish trend after Wall Street’s mixed signals and a dip in European indices from the day before. So far, US stock investors appear unfazed by global softness in commodities and bond markets, even as the 10-year Treasury yield inches closer to 4.5%, reflecting a more hawkish interest rate outlook for next year. But with the dust settling on Trump’s election victory, could we finally see retracement to cause a bearish shift in the short-term S&P 500 forecast?
After slightly hotter inflation data, Powell’s Speech eyed
We have seen this week’s inflation data come in slightly on the hotter side of things, fuelling the bond market sell-off. After a slightly stronger CPI report the day before, today’s PPI numbers showed a similar result. PPI is key indicator for traders since they’re closely tied to core Personal Consumption Expenditures (PCE), the Federal Reserve's preferred measure of inflation. As per analysts’ expectations, we saw a modest increase in headline PPI, printing +0.2% on a month-over-month basis, but the prior month was revised higher to 0.1% from 0.0%. Meanwhile core PPI rose by 0.3% after a 0.2% increase the month before.
Adding to today’s events, Fed Chair Jerome Powell is scheduled to speak in Dallas, focusing on the economic outlook. His comments may shed light on the Fed’s stance regarding recent inflation trends and the Trump administration’s protectionist policies. If Powell refrains from directly linking these factors to Fed policy, it might dampen market worries, reduce rate hike expectations, and provide some stability to the S&P 500 forecast.
Technical S&P 500 forecast
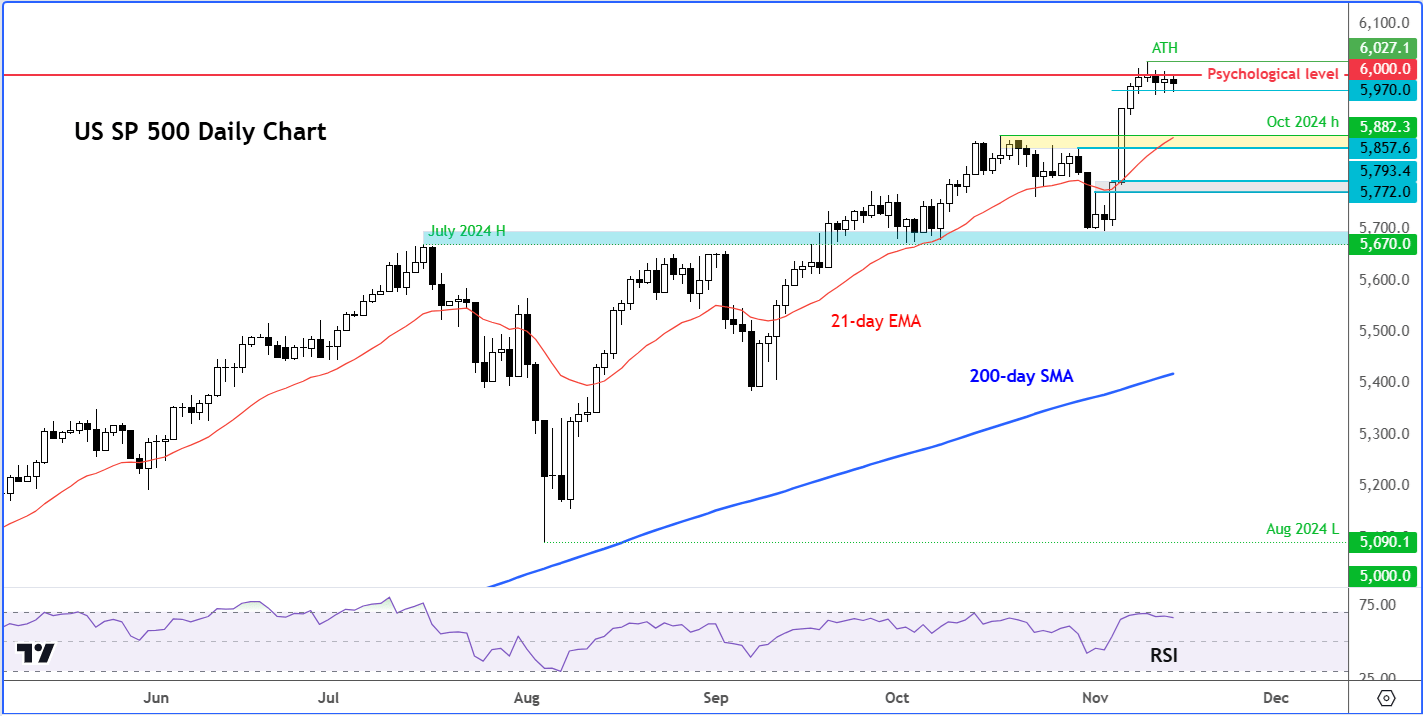
The S&P 500’s strong rally reflects optimism that Trump’s promises—like tax cuts and increased infrastructure spending—will support corporate growth. This bullish momentum remains intact, with investors reluctant to sell yet. Until we see a shift in the trend of higher highs and higher lows, it’s challenging to argue against the prevailing upward movement.
Yet, caution is warranted. The S&P 500 is clearly overbought by most metrics, including the Relative Strength Index (RSI). Even without the RSI, price action alone indicates lofty levels; the RSI itself hovers around 70 on daily, weekly, and monthly charts, signalling that a correction or consolidation may be due. For seasoned traders, a short-term pullback could offer buying opportunities, though a clear trend reversal signal has yet to emerge.
Source: TradingView.com
For now, watch for a potential dip below the 5970 level on the S&P 500 chart as an indicator of short-term downside. A decisive break here could suggest a move toward the next support zone between 5857 and 5882, a range that served as resistance through much of October. Additionally, the 21-day exponential moving average falls within this range, reinforcing its significance as support.
If the market breaches this zone, the next area to monitor would be around 5772-5793, where the election day low was made, marking an important psychological zone. The index must hold here to avoid a broader correction, which could shift sentiment towards a bearish technical S&P 500 forecast.
Conclusion
Although a full-fledged sell-off is appears unlikely without the index first breaking multiple support levels, current conditions suggest a modest pullback may be in order for the S&P 500. As overbought levels ease, fresh buying opportunities could emerge, keeping traders on alert for the next potential setup.
-- Written by Fawad Razaqzada, Market Analyst
Follow Fawad on Twitter @Trader_F_R
How to trade with City Index
You can trade with City Index by following these four easy steps:
- Open an account, or log in if you’re already a customer
• Open an account in the UK
• Open an account in Australia
• Open an account in Singapore
- Search for the company you want to trade in our award-winning platform
- Choose your position and size, and your stop and limit levels
- Place the trade
Related tags:
Latest market news



Open an account in minutes
Experience award-winning platforms with fast and secure execution, and enjoy tight spreads from 0.5 pts on FX and 0.3 pts on indices.
Economic calendar
Web Trader platform
Our sophisticated web-based platform is packed with features.
Related articles
S&P 500, Nasdaq, Dow Forecast: Wall Street Split Widens Into Month-End 9 26 2026
Nasdaq strength contrasts with mounting Dow pressure as rising Treasury yields raise the stakes for stocks heading into the monthly close.
EUR/USD weekly outlook: Oil, inflation and NFP in focus
After coming under significant pressure in recent weeks, the EUR/USD came off its lows to finish the week on a positive note on Friday, albeit with only a mild rebound. That was not enough to prevent the exchange rate falling for the third consecutive week, as the US dollar and bond yields rallied across the board.
Gold Q4 2026 outlook: Resilience in the face of rallying dollar and yields
As we headed towards the latter stages of Q3 and into Q4, the Fed had just hiked rates in a hawkish FOMC meeting, while the likes of the ECB and BoJ had also tightened their respective policies. Oil prices remained elevated amid the prolonged US-Iran conflict. Meanwhile, bond yields were breaking out, and the dollar was higher across the board. Yet, remarkably, gold was still holding in the positive territory for the third quarter, even if it had weakened somewhat in September.
This report is intended for general circulation only. It should not be construed as a recommendation, or an offer (or solicitation of an offer) to buy or sell any financial products. The information provided does not take into account your specific investment objectives, financial situation or particular needs. Before you act on any recommendation that may be contained in this report, independent advice ought to be sought from a financial adviser regarding the suitability of the investment product, taking into account your specific investment objectives, financial situation or particular needs.
StoneX Financial Pte. Ltd., may distribute reports produced by its respective foreign entities or affiliates within the StoneX group of companies or third parties pursuant to an arrangement under Regulation 32C of the Financial Advisers Regulations. Where the report is distributed to a person in Singapore who is not an accredited investor, expert investor or an institutional investor (as defined in the Securities Futures Act), StoneX Financial Pte. Ltd. accepts legal responsibility to such persons for the contents of the report only to the extent required by law. Singapore recipients should contact StoneX Financial Pte. Ltd. at 6826 9988 for matters arising from, or in connection with the report.
In the case of all other recipients of this report, to the extent permitted by applicable laws and regulations neither StoneX Financial Pte. Ltd. nor its associated companies will be responsible or liable for any loss or damage incurred arising out of, or in connection with, any use of the information contained in this report and all such liability is hereby expressly disclaimed. No representation or warranty is made, express or implied, that the content of this report is complete or accurate.
StoneX Financial Pte. Ltd. is not under any obligation to update this report.
Trading CFDs carries a high level of risk that may not be suitable for some investors. Consider your investment objectives, level of experience, financial resources, risk appetite and other relevant circumstances carefully. The possibility exists that you could lose some or all of your investments, including your initial deposits. If in doubt, please seek independent expert advice. Visit www.forex.com/en-sg/terms-and-policies for the complete Risk Disclosure Statement.