



S&P 500 forecast: What now for US stocks?
Global equities pushed higher through the first half of Thursday’s session, while US futures suggested a flat start for the S&P 500. The benchmark has advanced in seven of the past eight sessions, yet the rally now appears to be losing a touch of energy. With traders increasingly wary of overstretched valuations in AI and big-tech names, the key question hanging over markets is whether a potential Federal Reserve rate cut next week can trigger a so-called Santa rally.
Share this:

Global equities pushed higher through the first half of Thursday’s session, while US futures suggested a flat start for the S&P 500. The benchmark has advanced in seven of the past eight sessions, yet the rally now appears to be losing a touch of energy. With traders increasingly wary of overstretched valuations in AI and big-tech names, the key question hanging over markets is whether a potential Federal Reserve rate cut next week can trigger a so-called Santa rally. For now, the S&P 500 forecast remains cautiously constructive, albeit with more hesitancy creeping in.
Why have stocks been climbing?
Expectations of interest-rate cuts have been the primary tailwind. After November’s wobble, markets have regained their footing as investors rotate towards more defensive sectors, perhaps in recognition that some tech favourites have run a bit too hot. Softer sentiment in the US jobs market — combined with speculation that President Donald Trump may opt for a more dovish-leaning Fed chair — has nudged market pricing towards as many as four rate cuts by 2026.
Markets tend to relish the prospect of lower rates, and that optimism has so far offset wider concerns over weakening labour conditions and the uncomfortable reality that more firms are steadily replacing human roles with AI-driven efficiencies. For now, the S&P 500 forecast is being buoyed by rate-cut expectations rather than economic strength.
What are the risks on the radar?
If you strip away hopes of lower interest rates and stable inflation, supportive catalysts look rather thin. Market concentration remains a lingering worry, with the rally heavily dependent on a small cluster of mega-cap tech names — precisely the environment in which bubble chatter tends to grow.
Another potential risk comes from Japan, where rising bond yields have so far been shrugged off thanks to solid demand at recent auctions. But should global investors begin shifting out of equities and into bonds — particularly if concerns over the reverse carry trade resurface — the knock-on effects could drag on both US and global markets.
Add to that the broader recession risk hanging over corporate earnings. Up to now, none of these concerns has meaningfully derailed sentiment. But complacency is dangerous, and one has to ask whether this calm can really persist. It’s a theme increasingly feeding into traders’ S&P 500 forecast discussions.
Technical S&P 500 forecast and levels to watch
After last week’s sharp rebound, the S&P 500 has made limited progress so far this week. Even so, the structure retains a mildly bullish slant, largely because price action continues to hold above last week’s highs. At the time of writing, the market still looked constructive — just not energised. Several previously broken levels have now been reclaimed, reinforcing the impression that the bulls maintain a degree of control.
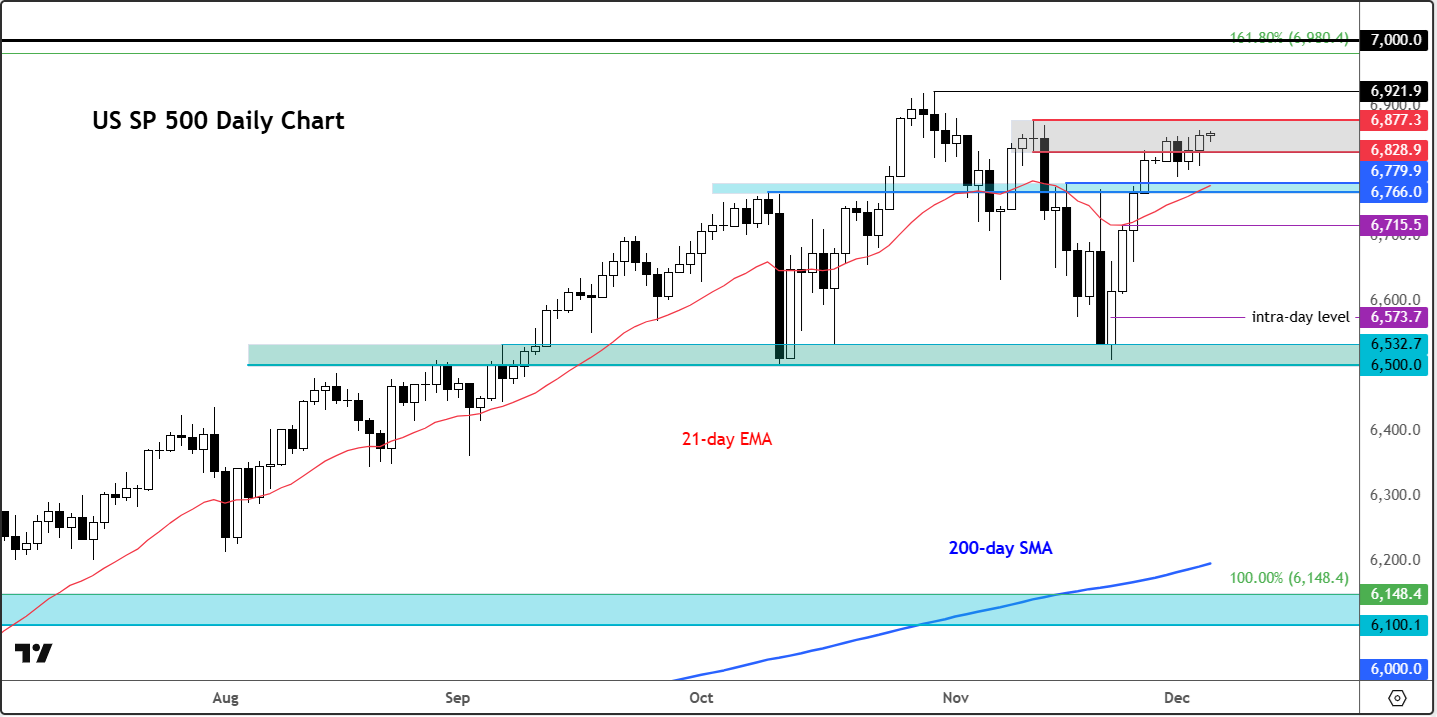
That said, without a meaningful catalyst, it is difficult to feel entirely confident that the index can genuinely extend from here. Sellers have effectively been sidelined in recent sessions, but a shift back towards bearish sentiment would require a clear reversal signal. For me, that would mean a decisive break below support at 6766–6780 — the blue-shaded zone on our UA AP 500 chart, which is derived from the underlying S&P 500 futures. A breach there could see the index sliding towards 6715 initially, with 6573, an intraday level, some distance below it. Beneath that, the range lows at 6500–6532 would come back into play as the next downside target.
Meanwhile on the upside there has been a bit of a supply band between 6829 to 6877 that the market has struggled to rise above in recent days. The bulls have been chipping away at it and yesterday managed a close within that zone, potentially eroding resistance. This is the same region from which sellers stepped in back in mid-November. If the bears are to regain the upper hand here again, this is the area they must defend. A clean break above 6877, however, opens the door to fresh all-time highs beyond the October peak at 6922. And should momentum carry through, a run towards 7000 — the next major psychological hurdle — feels entirely plausible.
In short: the technical bias still leans bullish, but momentum is lacking, leaving risks balanced on both sides. I’d like to see a decisive breakout above resistance or a proper breakdown below support before taking a firmer stance. For now, the market sits in something of a no-man’s-land, and from a purely technical perspective, the S&P 500 forecast remains neutral until the next clear trigger emerges.

-- Written by Fawad Razaqzada, Market Analyst
Follow Fawad on Twitter @Trader_F_R
Related tags:
Latest market news



Open an account in minutes
Experience award-winning platforms with fast and secure execution, and enjoy tight spreads from 0.5 pts on FX and 0.3 pts on indices.
Economic calendar
Web Trader platform
Our sophisticated web-based platform is packed with features.
Related articles
S&P 500, Nasdaq, Dow Forecast: Wall Street Split Widens Into Month-End 9 26 2026
Nasdaq strength contrasts with mounting Dow pressure as rising Treasury yields raise the stakes for stocks heading into the monthly close.
EUR/USD weekly outlook: Oil, inflation and NFP in focus
After coming under significant pressure in recent weeks, the EUR/USD came off its lows to finish the week on a positive note on Friday, albeit with only a mild rebound. That was not enough to prevent the exchange rate falling for the third consecutive week, as the US dollar and bond yields rallied across the board.
Gold Q4 2026 outlook: Resilience in the face of rallying dollar and yields
As we headed towards the latter stages of Q3 and into Q4, the Fed had just hiked rates in a hawkish FOMC meeting, while the likes of the ECB and BoJ had also tightened their respective policies. Oil prices remained elevated amid the prolonged US-Iran conflict. Meanwhile, bond yields were breaking out, and the dollar was higher across the board. Yet, remarkably, gold was still holding in the positive territory for the third quarter, even if it had weakened somewhat in September.
This report is intended for general circulation only. It should not be construed as a recommendation, or an offer (or solicitation of an offer) to buy or sell any financial products. The information provided does not take into account your specific investment objectives, financial situation or particular needs. Before you act on any recommendation that may be contained in this report, independent advice ought to be sought from a financial adviser regarding the suitability of the investment product, taking into account your specific investment objectives, financial situation or particular needs.
StoneX Financial Pte. Ltd., may distribute reports produced by its respective foreign entities or affiliates within the StoneX group of companies or third parties pursuant to an arrangement under Regulation 32C of the Financial Advisers Regulations. Where the report is distributed to a person in Singapore who is not an accredited investor, expert investor or an institutional investor (as defined in the Securities Futures Act), StoneX Financial Pte. Ltd. accepts legal responsibility to such persons for the contents of the report only to the extent required by law. Singapore recipients should contact StoneX Financial Pte. Ltd. at 6826 9988 for matters arising from, or in connection with the report.
In the case of all other recipients of this report, to the extent permitted by applicable laws and regulations neither StoneX Financial Pte. Ltd. nor its associated companies will be responsible or liable for any loss or damage incurred arising out of, or in connection with, any use of the information contained in this report and all such liability is hereby expressly disclaimed. No representation or warranty is made, express or implied, that the content of this report is complete or accurate.
StoneX Financial Pte. Ltd. is not under any obligation to update this report.
Trading CFDs carries a high level of risk that may not be suitable for some investors. Consider your investment objectives, level of experience, financial resources, risk appetite and other relevant circumstances carefully. The possibility exists that you could lose some or all of your investments, including your initial deposits. If in doubt, please seek independent expert advice. Visit www.forex.com/en-sg/terms-and-policies for the complete Risk Disclosure Statement.