


S&P 500, Nasdaq Forecast for The Week Ahead
With the Fed expected to cut rates again next week and investors pushing fresh ATHs in both SPX and NDX, there seems little reason to question the rally at this point.
Share this:

Stocks set fresh all-time-highs on Friday with both SPX and NDX gapping at the open and refusing to fill that in, helped along by the Friday CPI report. Next week brings some massive drivers with the Fed and Core PCE report set for release on Friday.

The tariff scare of two weeks ago is now firmly in the rear view as stocks were able to overtake prior highs this week, helped along by a strong opening gap on Friday following the CPI report. With the US government remaining shut down and the Fed highly expected to cut rates next week, there seems to be few reasons for investors to consider anything other than the rally that’s remained in place for much of the time since the April pullback.
Interestingly, however, it’s Powell’s performance at next week’s rate meeting which could potentially present some counter-trend motive. At the rate cut announcement in September, stocks initially pulled back on the announcement. There was a gap-higher the next morning and that gap came in as support a week later; but at Powell’s presser in July investors were starting to second guess rate cuts and that led to a large sell-off a day later, and that even lasted into the end of the week following the release of Non-farm Payrolls, when USD rallies were quickly extinguished in most major pairs.
I bring this up because chasing at this point, particularly after the unfilled gap on Friday fueled by that CPI release, is incredibly difficult from a strategy perspective. This isn’t necessarily something that’s attractive to fade because bulls have just continued to push, but it can highlight the value of patience and trying to pick an opportunistic mechanism for trend continuation.
From the daily chart of SPX there’s now a rising wedge that’s built and these are often approached with aim of bearish reversal. I would want to first see a breach of the 6700 handle before I would entertain short-term bearish stances, but even then, I think I’d prefer to bias this as bullish and wait for support to come into play at a level like 6550.
For shorter-term support, it’s the Friday gap that begins at 6738 and runs up to 6772 that remains of interest.
S&P 500 Daily Chart
Chart prepared by James Stanley; data derived from Tradingview
Nasdaq 100
The Nasdaq 100 similarly gapped-up on Friday and set a fresh all-time-high but the difference is that ahead of the move, there was a horizontal level of resistance that had held around 25,180. That, combined with the higher-lows, made for an ascending triangle and those are often approached with aim of bullish breakout, which is precisely what hit on Friday morning after the CPI report was priced-in.
That level also presents an attractive area to look for support to play. It’s a clear and obvious level so if it doesn’t hold, the concern is for a greater retracement or pullback scenario as likely something in the fundamental backdrop has shifted. And if that’s happening, patience on the pullback would likely be a warranted way forward, looking for something similar to what I had talked about in the Q4 forecast for equity indices.
Nasdaq 100 Daily Chart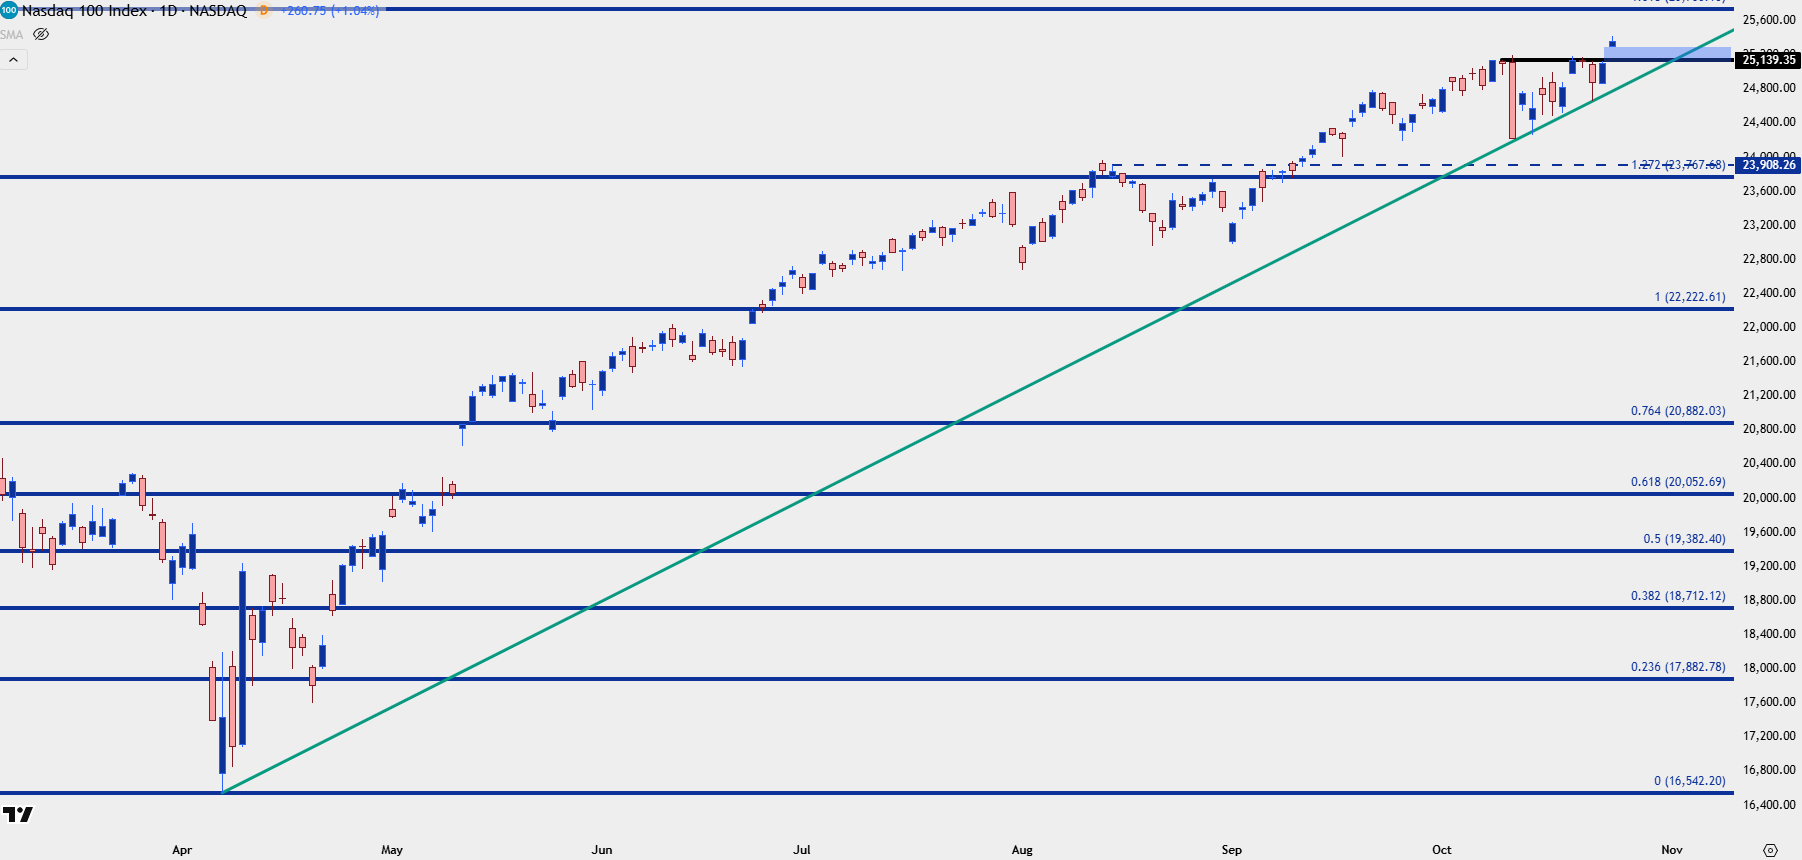
Chart prepared by James Stanley; data derived from Tradingview
--- written by James Stanley, Senior Strategist
Related tags:
Latest market news




Open an account in minutes
Experience award-winning platforms with fast and secure execution, and enjoy tight spreads from 0.5 pts on FX and 0.3 pts on indices.
Economic calendar
Web Trader platform
Our sophisticated web-based platform is packed with features.
Related articles
Nasdaq Breakout Potential into Q4 for Melt Up Scenarios
The headlines seem negative in almost any place that you look, with surging Treasury yields and frothy AI valuations getting more and more attention. But, if it’s so bad, why hasn’t the Nasdaq melted down yet, even as the Fed has started hiking rates?
S&P 500 Forecast: SPX rises after cooler-than-expected inflation data
U.S. stocks are rising and Treasury yields are falling after data showed that inflation increased at a cooler pace than expected, while U.S. consumer spending rose again in August.


Japanese Yen Technical Analysis: USD/JPY Support Test into Core PCE
USD/JPY has been a battlefield for the past two months as the force of intervention and the threat of more have given sellers an advantage, even as buyers have continued to bid support on pullbacks. This sets the stage for a massive finish to the week with Core PCE and Non-farm Payrolls.
This report is intended for general circulation only. It should not be construed as a recommendation, or an offer (or solicitation of an offer) to buy or sell any financial products. The information provided does not take into account your specific investment objectives, financial situation or particular needs. Before you act on any recommendation that may be contained in this report, independent advice ought to be sought from a financial adviser regarding the suitability of the investment product, taking into account your specific investment objectives, financial situation or particular needs.
StoneX Financial Pte. Ltd., may distribute reports produced by its respective foreign entities or affiliates within the StoneX group of companies or third parties pursuant to an arrangement under Regulation 32C of the Financial Advisers Regulations. Where the report is distributed to a person in Singapore who is not an accredited investor, expert investor or an institutional investor (as defined in the Securities Futures Act), StoneX Financial Pte. Ltd. accepts legal responsibility to such persons for the contents of the report only to the extent required by law. Singapore recipients should contact StoneX Financial Pte. Ltd. at 6826 9988 for matters arising from, or in connection with the report.
In the case of all other recipients of this report, to the extent permitted by applicable laws and regulations neither StoneX Financial Pte. Ltd. nor its associated companies will be responsible or liable for any loss or damage incurred arising out of, or in connection with, any use of the information contained in this report and all such liability is hereby expressly disclaimed. No representation or warranty is made, express or implied, that the content of this report is complete or accurate.
StoneX Financial Pte. Ltd. is not under any obligation to update this report.
Trading CFDs carries a high level of risk that may not be suitable for some investors. Consider your investment objectives, level of experience, financial resources, risk appetite and other relevant circumstances carefully. The possibility exists that you could lose some or all of your investments, including your initial deposits. If in doubt, please seek independent expert advice. Visit www.forex.com/en-sg/terms-and-policies for the complete Risk Disclosure Statement.