




Shorting crude oil could be getting ‘long’ in the tooth
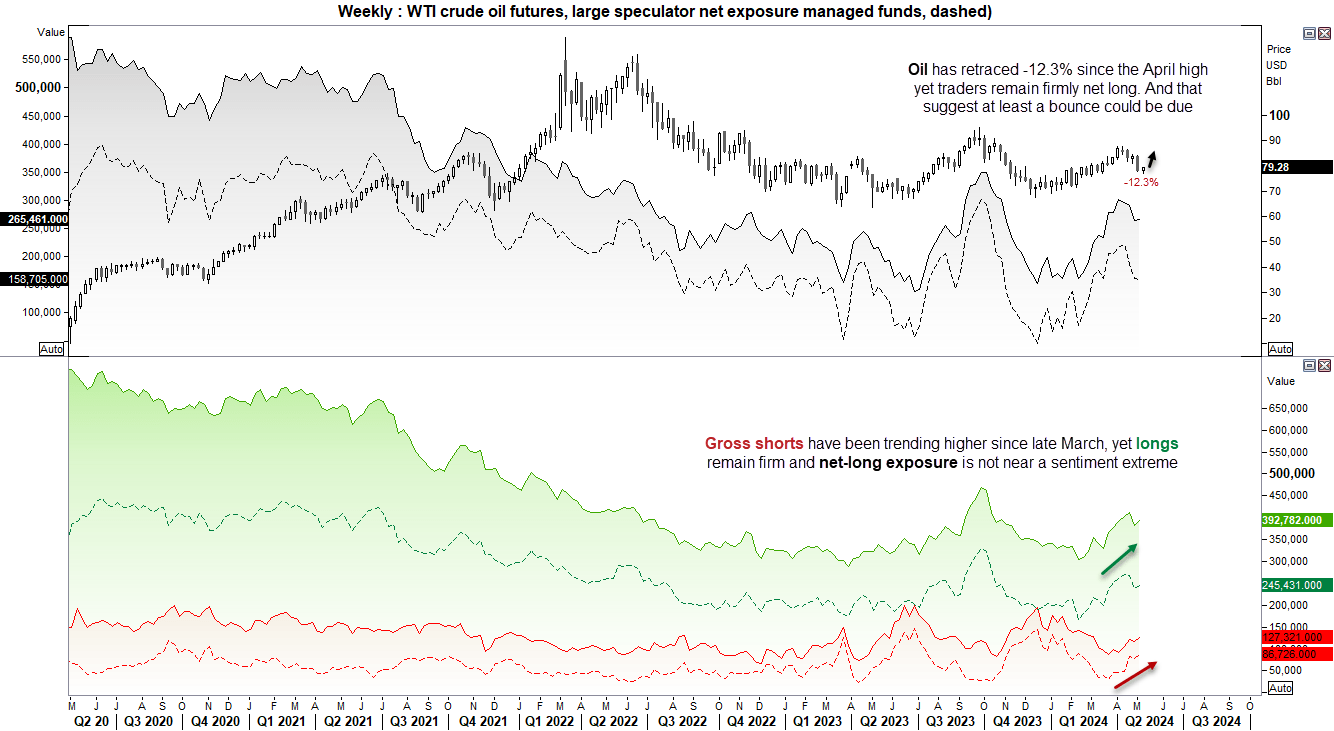
Oil bears have been busy over the past few weeks helping to send crude oil prices over 12% lower since the April highs. Yet recent price action suggests it could be set for a bounce.
Share this:

Market positioning for crude oil is not too hot, nor too cold
Short exposure to crude oil has been trending higher among large speculators and managed funds since late March, although clearly they remain net-long overall. And whilst long exposure dipped a couple of weeks ago, both sets of traders increased long exposure last week and net-long exposure remains at a healthy level overall. And neither is it at a sentiment extreme, to warn of a major trend change.
My take on this is that both the downside and upside potential for oil may be capped over the near-term. As underwhelming as this may be from a speculative perspective, it is still useful information to have, as it can manage our expectations accordingly; perhaps we’re not looking for an imminent move to $100 in the same way that a plunge to $60 seems far fetched. And as oil prices have fallen over 12% since the April high, perhaps shorting crude oil is becoming ‘long’ in the tooth.
WTI crude oil technical analysis (daily chart):
The daily chart shows a clear 3-wave retracement from the April high. And what makes me suspect it might mark the end of a correction is Wednesday’s bullish outside day, with a false break of $78 leaving a lower tail and recovery back above trend support. Given RSI (14) came very close to oversold last week and fell to its lowest level since December, a case for a bounce seems apparent.
That is not to say any such bounce will be a walk in the park, but I would err on the side of caution with being short around these lows.
What might make any rebound scrappy is that the 200-day average and EMA are near the $80. Already that seems to be having a dampening effect on prices rising for a second day, so bulls may want to see dips on lower timeframes and seek to exit around the averages or the $80 handle.
We’d likely need to see a break or daily close above the $80 handle or 200-day MA at $80.20 before being too confident that a decent bounce is underway. But with oil having fallen 12% in a few weeks, traders remaining net short and the potential for the US dollar to extend losses, my bet is that it will manage to break above $80.20 in due course.
WTI crude oil technical analysis (1-hour chart):
A mini v-bottom formed on the 1-hour chart of crude oil to suggest the low could be of significance. Furthermore, the baulk of trading volumes from the previous decline has occurred at the lows, and with prices rebounding sharply higher it implies that some of these bears would have already been forced to cover.
Yet with the RSI (14) curling lower and a bearish divergence having formed on the RSI (2) within the overbought zone, I am now seeking a retracement lower before a higher low forms. The broken bullish trendline or daily pivot point around 78.50 may offer some support, in which case bulls could then seek an entry at a lower price for an anticipated move towards the $80 handle. A decent break above which assumes bullish continuation in line with the bias outlined on the daily chart.
-- Written by Matt Simpson
Follow Matt on Twitter @cLeverEdge
How to trade with City Index
You can trade with City Index by following these four easy steps:
- Open an account, or log in if you’re already a customer
• Open an account in the UK
• Open an account in Australia
• Open an account in Singapore
- Search for the market you want to trade in our award-winning platform
- Choose your position and size, and your stop and limit levels
- Place the trade
Related tags:
Latest market news



Open an account in minutes
Experience award-winning platforms with fast and secure execution, and enjoy tight spreads from 0.5 pts on FX and 0.3 pts on indices.
Economic calendar
Web Trader platform
Our sophisticated web-based platform is packed with features.
Related articles
S&P 500 forecast: Stocks extend drop as correction risks grow
US and global equity markets have extended Wednesday’s sell-off, with Wall Street opening lower after a weak handover from Asia and Europe. The deterioration in risk appetite has been spreading across global markets. The dollar was firmer, Treasury yields were holding onto yesterday’s gains, while gold, silver and bitcoin were all under pressure alongside equities and major currencies.
Wall Street Forecast: DJIA falls as treasury yields hit new highs and ahead of the Trump-Xi summit
U.S. stocks are falling, further extending losses from the previous session, as oil prices move higher alongside Treasury yields and caution reigns ahead of the summit between President Trump and Xi Jinping.

Gold forecast: XAU/USD could take a larger dive after the big rise in yields
Gold prices have been falling in the last few days after last week’s post-FOMC pop faded amid rising interest rate expectations, higher oil prices and a strengthening US dollar. As before, I wasn’t convinced gold would thrive in the current macro backdrop.
This report is intended for general circulation only. It should not be construed as a recommendation, or an offer (or solicitation of an offer) to buy or sell any financial products. The information provided does not take into account your specific investment objectives, financial situation or particular needs. Before you act on any recommendation that may be contained in this report, independent advice ought to be sought from a financial adviser regarding the suitability of the investment product, taking into account your specific investment objectives, financial situation or particular needs.
StoneX Financial Pte. Ltd., may distribute reports produced by its respective foreign entities or affiliates within the StoneX group of companies or third parties pursuant to an arrangement under Regulation 32C of the Financial Advisers Regulations. Where the report is distributed to a person in Singapore who is not an accredited investor, expert investor or an institutional investor (as defined in the Securities Futures Act), StoneX Financial Pte. Ltd. accepts legal responsibility to such persons for the contents of the report only to the extent required by law. Singapore recipients should contact StoneX Financial Pte. Ltd. at 6826 9988 for matters arising from, or in connection with the report.
In the case of all other recipients of this report, to the extent permitted by applicable laws and regulations neither StoneX Financial Pte. Ltd. nor its associated companies will be responsible or liable for any loss or damage incurred arising out of, or in connection with, any use of the information contained in this report and all such liability is hereby expressly disclaimed. No representation or warranty is made, express or implied, that the content of this report is complete or accurate.
StoneX Financial Pte. Ltd. is not under any obligation to update this report.
Trading CFDs carries a high level of risk that may not be suitable for some investors. Consider your investment objectives, level of experience, financial resources, risk appetite and other relevant circumstances carefully. The possibility exists that you could lose some or all of your investments, including your initial deposits. If in doubt, please seek independent expert advice. Visit www.forex.com/en-sg/terms-and-policies for the complete Risk Disclosure Statement.