





Silver Outshines Gold
Silver looks to continue to outperform gold in the short-term.
Share this:

As my colleague Matt wrote last week, the gold/silver ratio currently favors silver. With negative yields around the world and the threat of the FOMC cutting rates again in September, precious metals have been in vogue as of late. Let’s take a look at some shorter-term action over the last couple of months.
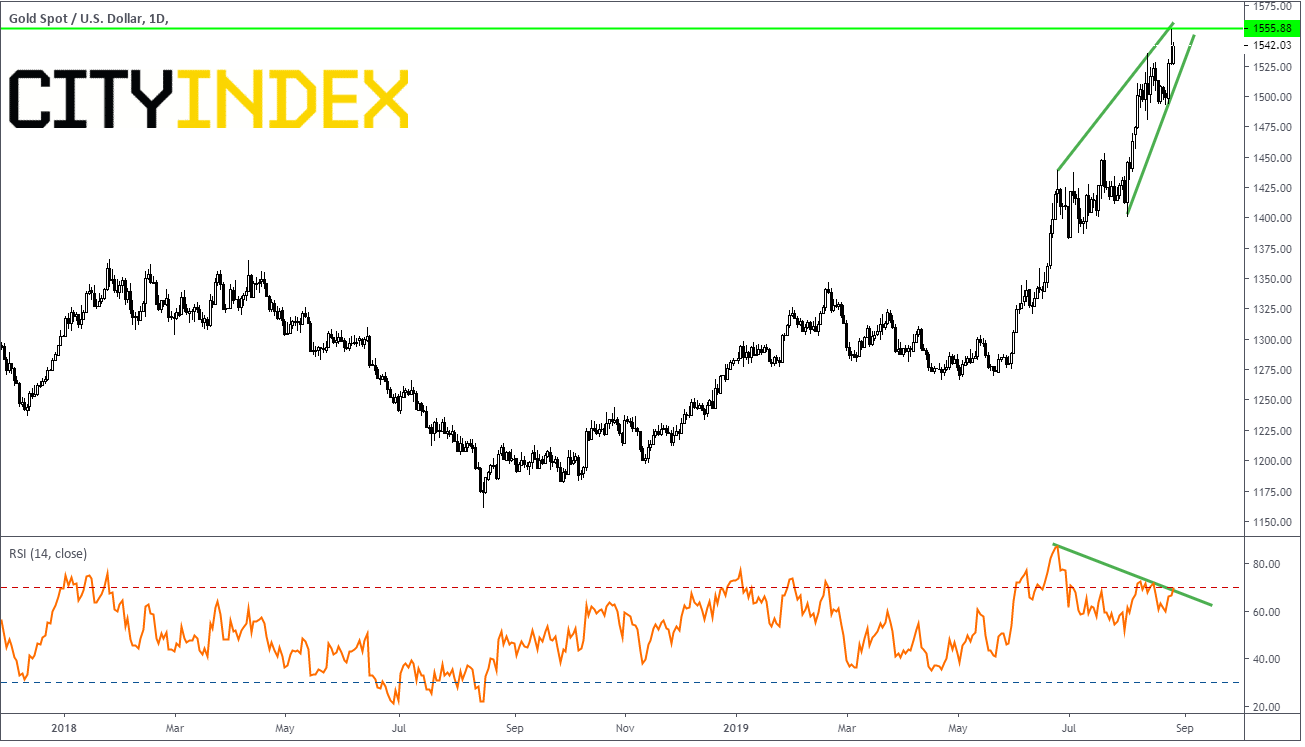
Looking at gold, the yellow metal has been moving higher since the end of May and has slammed right up against horizonal resistance at 1588, dating back to April 2013. Gold currently is in a rising wedge with a divergent RSI. This formation makes it ripe for a possible pullback as far down as 1406. The target for a breakdown of a rising wedge is 100% of the wedge.
Source: Tradingview, City Index
Where has silver been during the run up in gold? Silver didn’t begin moving up in earnest until mid-July, at which point it began to outperform gold. Currently, silver is trading near 18.18, up over 3.0% on the day and up over 9% in the last 3 days! Silver is heading into trendline resistance and the RSI is in overbought conditions. Silver, like gold, also looks ready for a pullback with first support at the bottom trendline, near 17.75.
Source: Tradingview, City Index
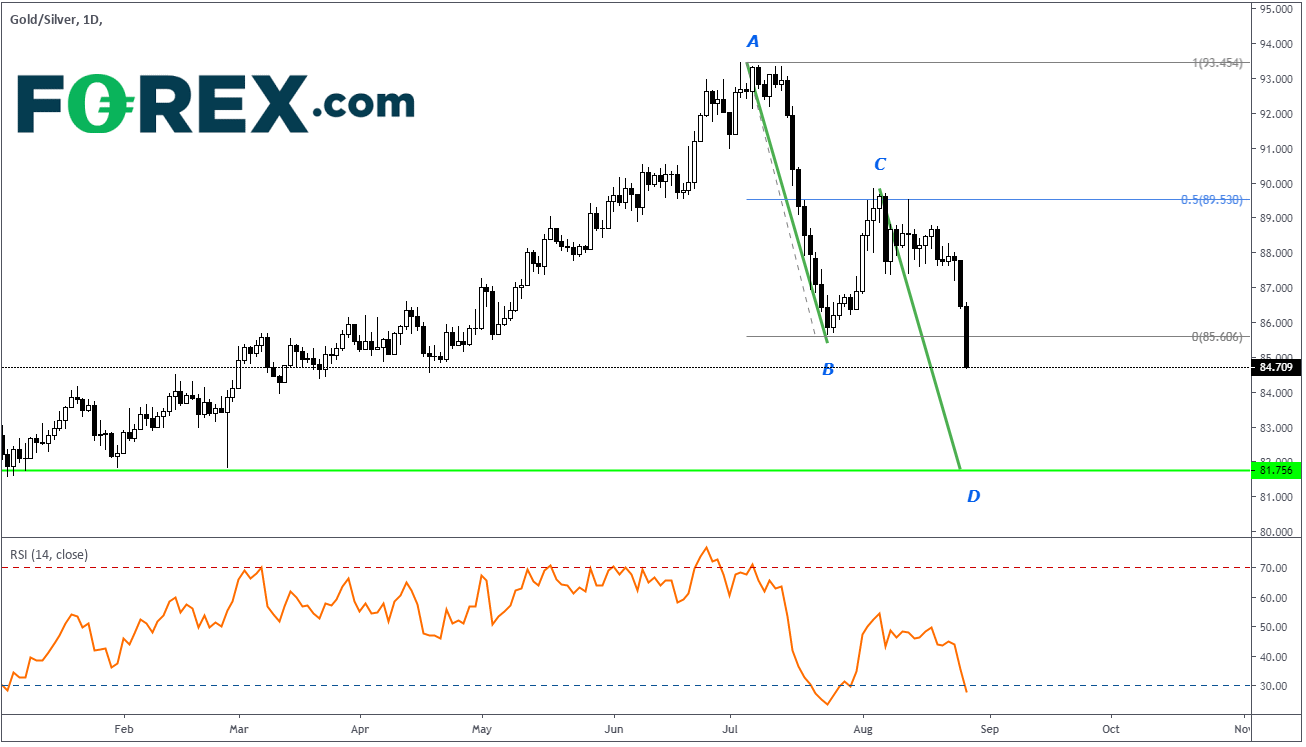
As silver began to outpace gold in July, the gold/sliver ratio began to roll over. The ratio put in a high near 93.45 and traded off into the end of July to 85.60. It then bounced 50% of the move from the mid July high to the end of July low. The high on August 5th was 89.84. This set up an almost perfect AB=CD pattern, where the length of A to B should equal the length of C to D.
Source: Tradingview, City Index
Although price never moves in a straight line, if that is the case here, it would suggest a target of 81.75 in the gold/silver ratio. This would mean continued out performance of silver over gold in the short-term.
As my colleague Matt wrote last week, the gold/silver ratio currently favors silver. With negative yields around the world and the threat of the FOMC cutting rates again in September, precious metals have been in vogue as of late. Let’s take a look at some shorter-term action over the last couple of months.
Looking at gold, the yellow metal has been moving higher since the end of May and has slammed right up against horizonal resistance at 1588, dating back to April 2013. Gold currently is in a rising wedge with a divergent RSI. This formation makes it ripe for a possible pullback as far down as 1406. The target for a breakdown of a rising wedge is 100% of the wedge.
Source: Tradingview, FOREX.com
Where has silver been during the run up in gold? Silver didn’t begin moving up in earnest until mid-July, at which point it began to outperform gold. Currently, silver is trading near 18.18, up over 3.0% on the day and up over 9% in the last 3 days! Silver is heading into trendline resistance and the RSI is in overbought conditions. Silver, like gold, also looks ready for a pullback with first support at the bottom trendline, near 17.75.
Source: Tradingview, FOREX.com
As silver began to outpace gold in July, the gold/sliver ratio began to roll over. The ratio put in a high near 93.45 and traded off into the end of July to 85.60. It then bounced 50% of the move from the mid July high to the end of July low. The high on August 5th was 89.84. This set up an almost perfect AB=CD pattern, where the length of A to B should equal the length of C to D.
Source: Tradingview, FOREX.com
Although price never moves in a straight line, if that is the case here, it would suggest a target of 81.75 in the gold/silver ratio. This would mean continued out performance of silver over gold in the short-term.
Related tags:
Latest market news




Open an account in minutes
Experience award-winning platforms with fast and secure execution, and enjoy tight spreads from 0.5 pts on FX and 0.3 pts on indices.
Economic calendar
Web Trader platform
Our sophisticated web-based platform is packed with features.
Related articles
Gold Q4 2026 outlook: Resilience in the face of rallying dollar and yields
As we headed towards the latter stages of Q3 and into Q4, the Fed had just hiked rates in a hawkish FOMC meeting, while the likes of the ECB and BoJ had also tightened their respective policies. Oil prices remained elevated amid the prolonged US-Iran conflict. Meanwhile, bond yields were breaking out, and the dollar was higher across the board. Yet, remarkably, gold was still holding in the positive territory for the third quarter, even if it had weakened somewhat in September.

Gold forecast: XAU/USD could take a larger dive after the big rise in yields
Gold prices have been falling in the last few days after last week’s post-FOMC pop faded amid rising interest rate expectations, higher oil prices and a strengthening US dollar. As before, I wasn’t convinced gold would thrive in the current macro backdrop.

WTI Crude Oil Mulls Bounce from $90
Having fallen 17% from its cycle highs in just five days and now holding above $90, perhaps it could be time for crude oil to bounce over the near term.

This report is intended for general circulation only. It should not be construed as a recommendation, or an offer (or solicitation of an offer) to buy or sell any financial products. The information provided does not take into account your specific investment objectives, financial situation or particular needs. Before you act on any recommendation that may be contained in this report, independent advice ought to be sought from a financial adviser regarding the suitability of the investment product, taking into account your specific investment objectives, financial situation or particular needs.
StoneX Financial Pte. Ltd., may distribute reports produced by its respective foreign entities or affiliates within the StoneX group of companies or third parties pursuant to an arrangement under Regulation 32C of the Financial Advisers Regulations. Where the report is distributed to a person in Singapore who is not an accredited investor, expert investor or an institutional investor (as defined in the Securities Futures Act), StoneX Financial Pte. Ltd. accepts legal responsibility to such persons for the contents of the report only to the extent required by law. Singapore recipients should contact StoneX Financial Pte. Ltd. at 6826 9988 for matters arising from, or in connection with the report.
In the case of all other recipients of this report, to the extent permitted by applicable laws and regulations neither StoneX Financial Pte. Ltd. nor its associated companies will be responsible or liable for any loss or damage incurred arising out of, or in connection with, any use of the information contained in this report and all such liability is hereby expressly disclaimed. No representation or warranty is made, express or implied, that the content of this report is complete or accurate.
StoneX Financial Pte. Ltd. is not under any obligation to update this report.
Trading CFDs carries a high level of risk that may not be suitable for some investors. Consider your investment objectives, level of experience, financial resources, risk appetite and other relevant circumstances carefully. The possibility exists that you could lose some or all of your investments, including your initial deposits. If in doubt, please seek independent expert advice. Visit www.forex.com/en-sg/terms-and-policies for the complete Risk Disclosure Statement.