



Silver stalls above $50 as reversal signal emerges
After a powerful squeeze, silver is showing signs of a shift. A reversal signal has appeared just as volatility spikes.
Share this:

- Spot silver trades at a premium to futures, triggering arbitrage trades
- Borrowing costs spike as inventories are drained
- Indian demand rebounds, adding fuel to the rally
- Reversal signals emerge, but confirmation is still pending
Summary
Silver’s rally may have just run into trouble. After a blistering squeeze that pushed prices above $50, a reversal pattern has emerged, raising the risk of an unwind. We look at technical setups, key levels to watch, and what traders should look for next should momentum begin to shift.
Silver Squeeze Fuels Upside
The London silver market has been thrown into chaos by a brutal short squeeze, sending prices above $50 an ounce for only the second time in history. Spot rates traded at a steep premium to futures expiring in December, fuelling arbitrage trades that drained inventories and pushed borrowing rates above 100% annualised, making it prohibitively costly to stay short.
Years of supply deficits, heavy industrial use and ballooning shipments to the US have left London with its thinnest silver liquidity in decades. Bid-ask spreads have blown out as institutional market participants withdrew to the sidelines, amplifying volatility.
Indian demand has also rebounded after a strong monsoon season, lifting jewellery and investment demand in a market that accounts for about 16% of global fabrication. Combined with broader safe-haven buying on debt and currency debasement fears, the squeeze has proven powerful, sending silver up nearly 90% from the lows struck in April, including 30% over the past month.


Reversal Signal Arrives
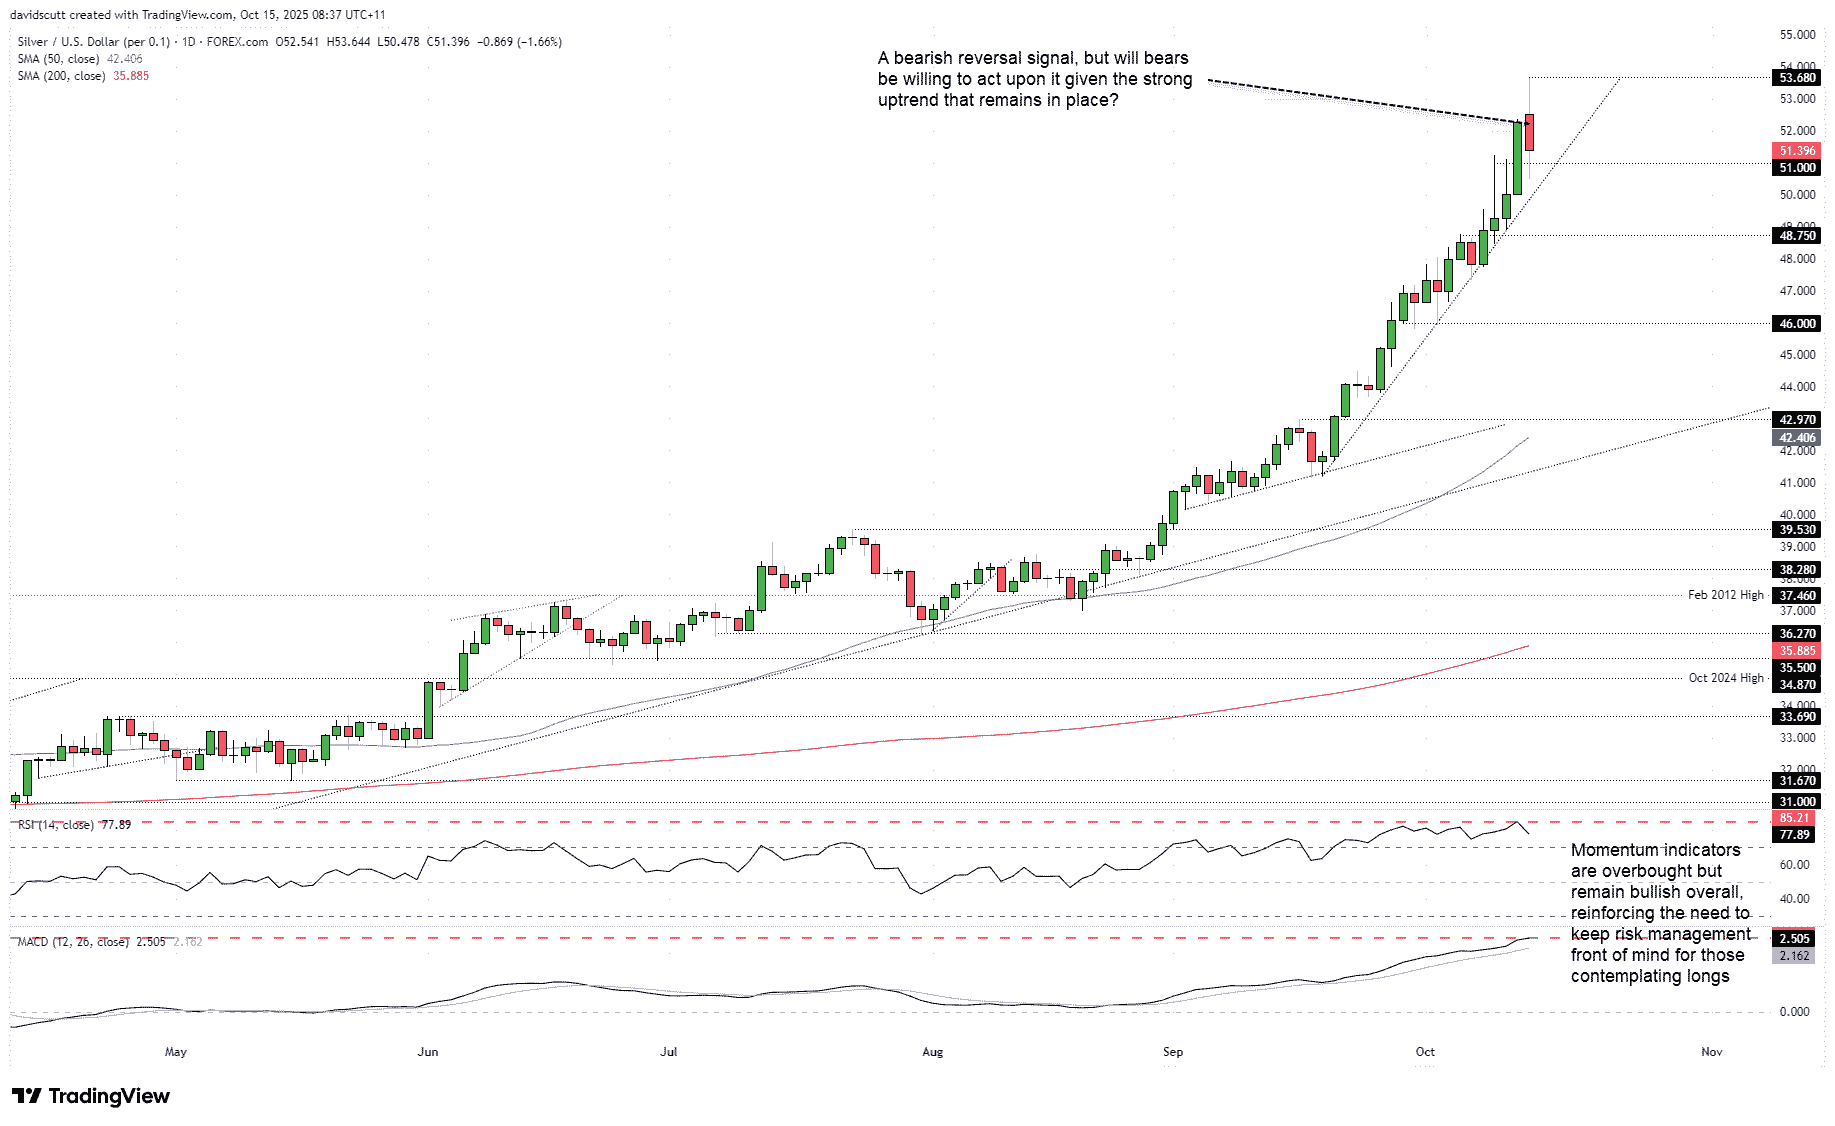
However, after such a dramatic run-up—driven in part by forced purchases—silver is now extremely overbought on numerous timeframes, creating the risk of an abrupt reversal should falling prices force late-to-the-party bulls to cover their positions. With Tuesday’s daily candle providing a clear reversal pattern, bears have been given an invitation to heap pain on newly established longs, if they choose to accept it.
The price gapped higher on the open, soared to multi-decade highs, but then reversed sharply, closing around halfway up the body of the prior day’s candle. This formed a dark cloud cover pattern often seen around market peaks. However, while other reversal patterns like evening stars, bearish engulfers, and key reversals have proven to be decent signals for traders in recent times, dark cloud covers have been few and far between, raising questions over the reliability of the signal. Throw in the strong uptrend the price finds itself in, and the inclination is to wait and see how the price action plays out in Asia.
Silver Trade Setups
Source: TradingView
If we were to see a break and close beneath the September 18 uptrend, it would help strengthen the price signal provided on Tuesday. It’s currently found around $50, with minor support at $51 and $48.75 located either side. If the latter were to be taken out, $46 and $42.97 are the levels to watch. If we were to see a sustained break beneath the uptrend, shorts could be established beneath it with a tight stop above to protect against reversal.
However, if we were to see another failure to sustain a push below $51—as seen late Tuesday—it would open the door for long positions to be established, allowing for entry above the level with a stop beneath for protection. Tuesday’s high of $53.68 would be the logical initial target.
While RSI (14) and MACD continue to generate strong bullish signals that favour buying dips, both indicators remain overbought on the daily timeframe, emphasising the need for risk management given the elevated risk of reversal.


Open an account in minutes
Experience award-winning platforms with fast and secure execution, and enjoy tight spreads from 0.5 pts on FX and 0.3 pts on indices.
Economic calendar
Web Trader platform
Our sophisticated web-based platform is packed with features.
Related articles

Nikkei breakout accelerates as yen weakness returns
Nikkei has started October with a powerful breakout, helped by renewed yen weakness and strong upside momentum

AUD/USD hammered by US yields and fading RBA hike bets
US yields, dollar strength and fading RBA hike bets have combined to drive AUD/USD to fresh multi-month lows. The macro and technical bias remains bearish, although history suggests parts of the move are now reaching unusually stretched levels.

Canadian Dollar Forecast: USD/CAD Four-Week Rally Eyes Yearly Highs 9 30 2026
USD/CAD has advanced in 14 of the past 15 sessions, but stretched momentum raises the stakes as major resistance and NFP come into focus.

This report is intended for general circulation only. It should not be construed as a recommendation, or an offer (or solicitation of an offer) to buy or sell any financial products. The information provided does not take into account your specific investment objectives, financial situation or particular needs. Before you act on any recommendation that may be contained in this report, independent advice ought to be sought from a financial adviser regarding the suitability of the investment product, taking into account your specific investment objectives, financial situation or particular needs.
StoneX Financial Pte. Ltd., may distribute reports produced by its respective foreign entities or affiliates within the StoneX group of companies or third parties pursuant to an arrangement under Regulation 32C of the Financial Advisers Regulations. Where the report is distributed to a person in Singapore who is not an accredited investor, expert investor or an institutional investor (as defined in the Securities Futures Act), StoneX Financial Pte. Ltd. accepts legal responsibility to such persons for the contents of the report only to the extent required by law. Singapore recipients should contact StoneX Financial Pte. Ltd. at 6826 9988 for matters arising from, or in connection with the report.
In the case of all other recipients of this report, to the extent permitted by applicable laws and regulations neither StoneX Financial Pte. Ltd. nor its associated companies will be responsible or liable for any loss or damage incurred arising out of, or in connection with, any use of the information contained in this report and all such liability is hereby expressly disclaimed. No representation or warranty is made, express or implied, that the content of this report is complete or accurate.
StoneX Financial Pte. Ltd. is not under any obligation to update this report.
Trading CFDs carries a high level of risk that may not be suitable for some investors. Consider your investment objectives, level of experience, financial resources, risk appetite and other relevant circumstances carefully. The possibility exists that you could lose some or all of your investments, including your initial deposits. If in doubt, please seek independent expert advice. Visit www.forex.com/en-sg/terms-and-policies for the complete Risk Disclosure Statement.