





S&P 500 Four Weeks Down, First Time Since August Lows
It’s been a fast re-pricing in stocks over the past four weeks and this week brings the Fed.
Share this:

S&P 500 Talking Points:
- The S&P 500 finished its fourth consecutive weekly loss last week, and that’s only the second time for such an occurrence since the 2024 open, with the only other instance taking place last July and August which was then followed by an approximate 14% rally in the index over the next few months.
- Also of note from last week was the first trip below the 200-day moving average for the index since November of 2023. Friday brought a vigorous bounce with the weekly close holding at a major area of interest on the chart at 5638, looked at in the weekend forecast and explained further below.
- The big item on the economic calendar for this week is the FOMC rate decision on Wednesday, and I’ll be previewing that event in the weekly webinar on Tuesday. Click here for registration information.
It’s been a rough past month for the S&P 500, as the index has seen losses on the weekly chart for four consecutive weeks. That’s not a very common occurrence, particularly over the past couple of years, and the last time that happened was August of last year, right around when the low had set in the second half of 2024.
Interestingly, the same zone of resistance that’s in-play right now was what had turned around the index back then, with the 61.8% Fibonacci extension of the 2022 sell-off marking the high. That resistance led to three consecutive sell-offs on the weekly, followed by a massive gap down for week four that then saw bulls make a return; although they weren’t quite able to close that week above the prior weekly close which is what allowed four the fourth consecutive weekly loss.
But bulls showed back up in a big way, thereafter, rallying stocks for almost 14% over the next few months, through the U.S. Presidential Election.
S&P 500 Weekly Chart
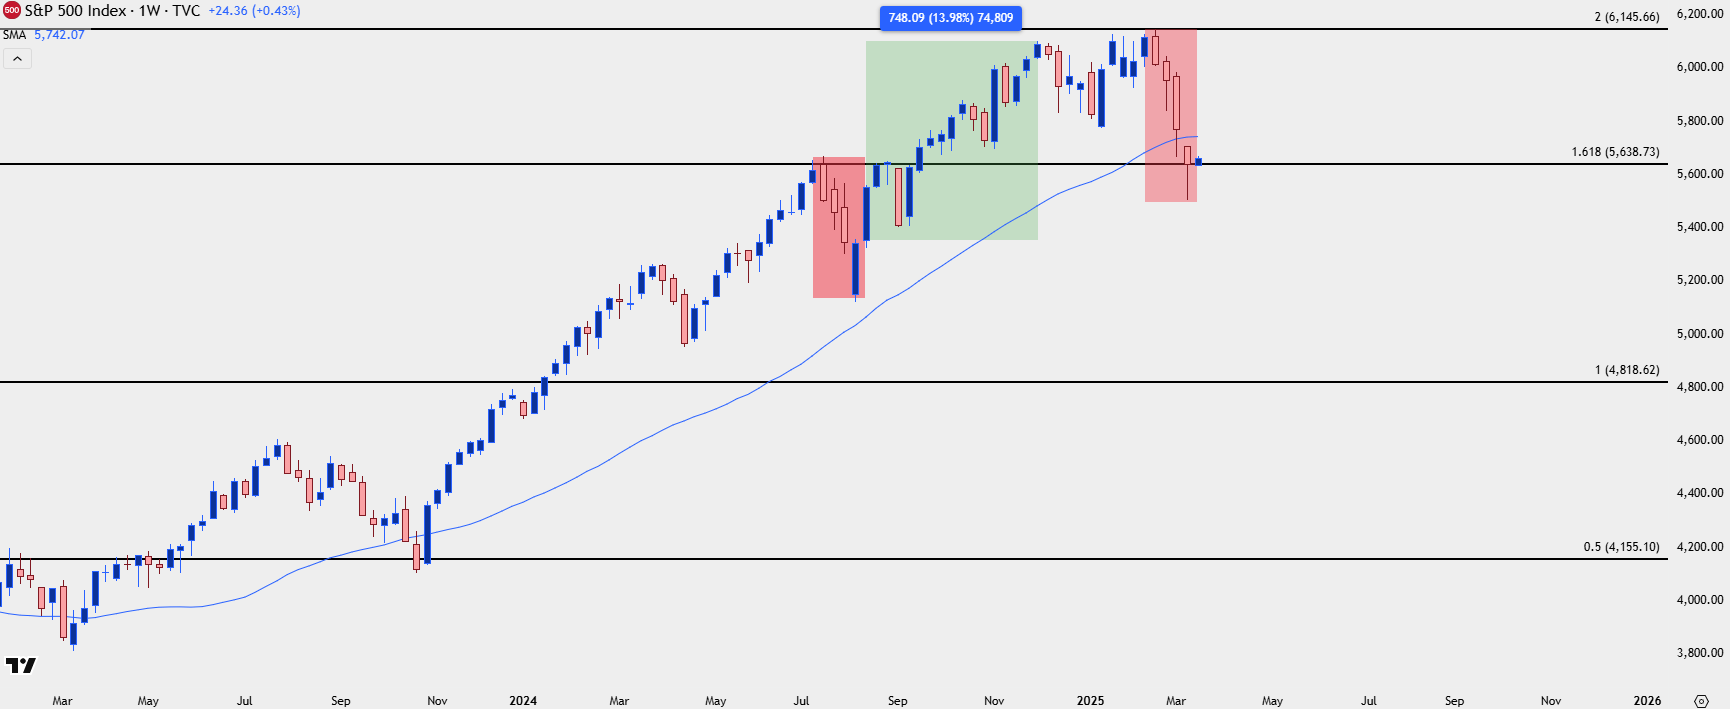 Chart prepared by James Stanley; data derived from Tradingview
S&P 500 Shorter-Term
SPX has fallen by as much as 10.46% from the February highs that were set less than a month ago, so it’s perhaps the speed with which this pullback has appeared that’s been most surprising. But perhaps the larger question is whether the momentum feeds itself, further incentivizing selling from both longs and opening shorts.
The combination of factors contributing to the indexes decline can make for a challenging backdrop for bears, and something like this could have an impact this week as we hear from the Federal Reserve with an updated Summary of Economic Projections.
Last week saw the index slip below it’s 200-day moving average for the first time since Q4 of 2023. That episode was brief, however, lasting a little longer than a week and followed quickly by the return of bulls as stocks ramped for the next few months, and continued ramping until July when that prior streak of four consecutive weekly losses appeared.
Also of interest is the RSI indicator, which went oversold on the daily chart for the first time Q4 of 2023, along with the last instance of a trip below the 200dma and right around the October low.
The Friday rally in SPX helped the indicator to recover out of oversold territory. And, notably, that prior instance of oversold RSI was a second show as RSI divergence had begun to appear from the prior instance. Which begs the question as to whether we may be lining up for something similar over the next week with the Fed taking center stage.
For bears that are looking for a chance to take a bearish stance on the index, there’s a couple of key spots sitting overhead. The prior weekly close at 5770 has some remaining unfilled gap, and that’s nearing confluence with the 200-day moving average that plots 30 points lower. On a shorter-term basis which I’ll look at below, 5670 is of interest as this is the top of the support zone I had discussed in this weekend’s technical forecast.
SPX Daily Chart
 Chart prepared by James Stanley; data derived from Tradingview
S&P 500 Daily Chart
There’ve been numerous bearish short-term twists over the past couple of years and each time, the Fed has helped to prod support into the matter. Given an FOMC rate decision on the calendar for this week along with updated projections at this quarterly meeting, it would seem that the bank has ample opportunity to do something similar here. This brings to question the ‘Fed put’ narrative and whether we’ll hear Jerome Powell talk up the prospect of softer policy and accommodation later in the year, or whether he’ll take a more hardline stance on the matter.
At this point the index has recovered just about 23.6% of the recent sell-off, and the 38.2% retracement of that move is confluent with the 200-day moving average, so that would present another spot of possible resistance. If prices can punch up to that level, however, there would also be an opening door for recovery themes – provided that the 5638-5670 zone could hold higher-low supports; and that would open the door for a move up to 5824 which is the 50% mark of the recent sell-off.
For bears, the next major area of longer-term support on the chart is the 5340-5402 zone that I had looked at as my ‘s3’ zone in the 2025 forecast for indices.
SPX Four-Hour Chart
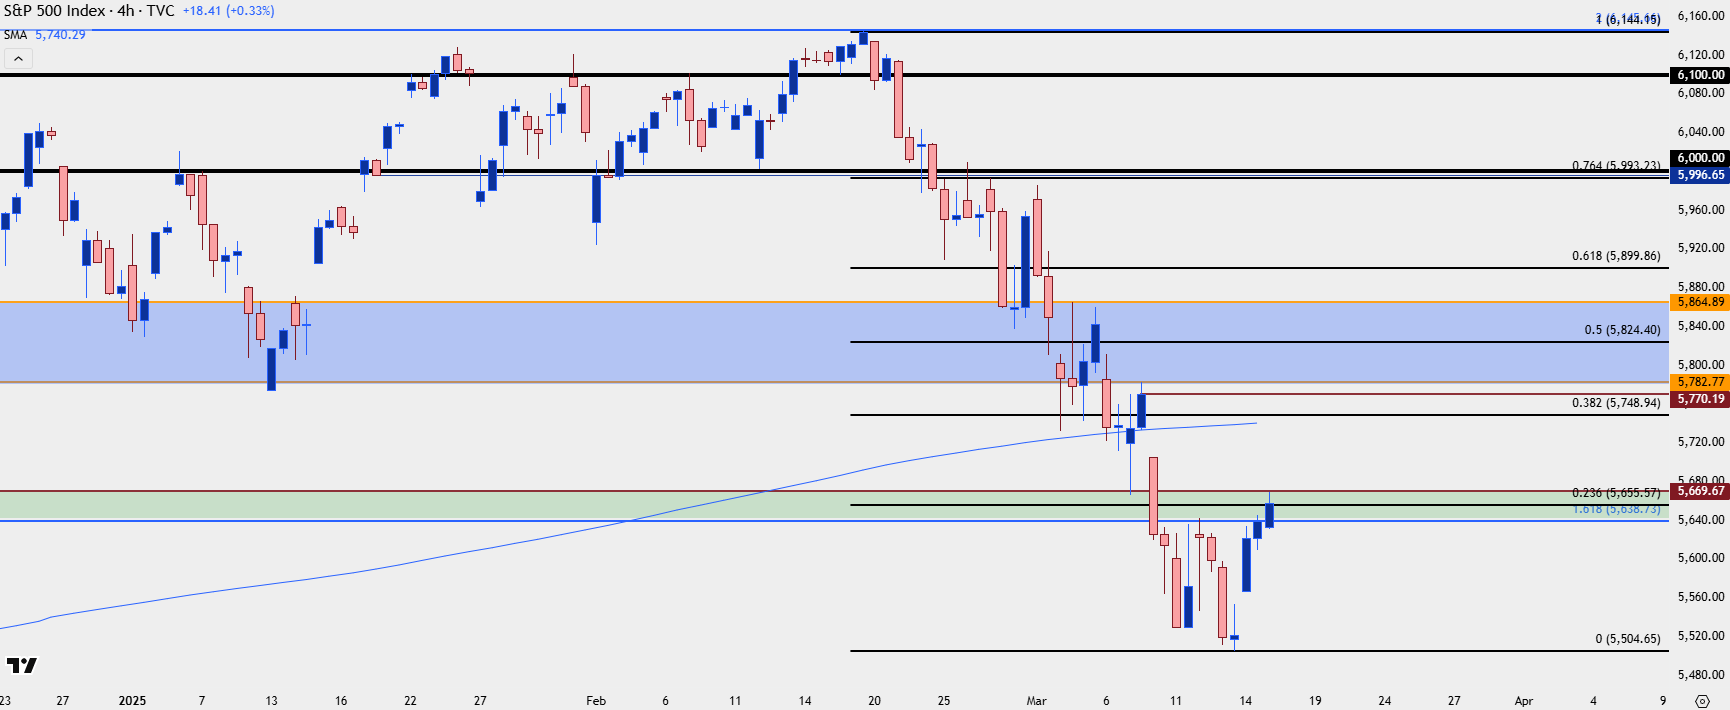 Chart prepared by James Stanley; data derived from Tradingview
--- written by James Stanley, Senior Strategist
S&P 500 Talking Points:
- The S&P 500 finished its fourth consecutive weekly loss last week, and that’s only the second time for such an occurrence since the 2024 open, with the only other instance taking place last July and August which was then followed by an approximate 14% rally in the index over the next few months.
- Also of note from last week was the first trip below the 200-day moving average for the index since November of 2023. Friday brought a vigorous bounce with the weekly close holding at a major area of interest on the chart at 5638, looked at in the weekend forecast and explained further below.
- The big item on the economic calendar for this week is the FOMC rate decision on Wednesday, and I’ll be previewing that event in the weekly webinar on Tuesday. Click here for registration information.
It’s been a rough past month for the S&P 500, as the index has seen losses on the weekly chart for four consecutive weeks. That’s not a very common occurrence, particularly over the past couple of years, and the last time that happened was August of last year, right around when the low had set in the second half of 2024.
Interestingly, the same zone of resistance that’s in-play right now was what had turned around the index back then, with the 61.8% Fibonacci extension of the 2022 sell-off marking the high. That resistance led to three consecutive sell-offs on the weekly, followed by a massive gap down for week four that then saw bulls make a return; although they weren’t quite able to close that week above the prior weekly close which is what allowed four the fourth consecutive weekly loss.
But bulls showed back up in a big way, thereafter, rallying stocks for almost 14% over the next few months, through the U.S. Presidential Election.
S&P 500 Weekly Chart
Chart prepared by James Stanley; data derived from Tradingview
S&P 500 Shorter-Term
SPX has fallen by as much as 10.46% from the February highs that were set less than a month ago, so it’s perhaps the speed with which this pullback has appeared that’s been most surprising. But perhaps the larger question is whether the momentum feeds itself, further incentivizing selling from both longs and opening shorts.
The combination of factors contributing to the indexes decline can make for a challenging backdrop for bears, and something like this could have an impact this week as we hear from the Federal Reserve with an updated Summary of Economic Projections.
Last week saw the index slip below it’s 200-day moving average for the first time since Q4 of 2023. That episode was brief, however, lasting a little longer than a week and followed quickly by the return of bulls as stocks ramped for the next few months, and continued ramping until July when that prior streak of four consecutive weekly losses appeared.
Also of interest is the RSI indicator, which went oversold on the daily chart for the first time Q4 of 2023, along with the last instance of a trip below the 200dma and right around the October low.
The Friday rally in SPX helped the indicator to recover out of oversold territory. And, notably, that prior instance of oversold RSI was a second show as RSI divergence had begun to appear from the prior instance. Which begs the question as to whether we may be lining up for something similar over the next week with the Fed taking center stage.
For bears that are looking for a chance to take a bearish stance on the index, there’s a couple of key spots sitting overhead. The prior weekly close at 5770 has some remaining unfilled gap, and that’s nearing confluence with the 200-day moving average that plots 30 points lower. On a shorter-term basis which I’ll look at below, 5670 is of interest as this is the top of the support zone I had discussed in this weekend’s technical forecast.
SPX Daily Chart
Chart prepared by James Stanley; data derived from Tradingview
S&P 500 Daily Chart
There’ve been numerous bearish short-term twists over the past couple of years and each time, the Fed has helped to prod support into the matter. Given an FOMC rate decision on the calendar for this week along with updated projections at this quarterly meeting, it would seem that the bank has ample opportunity to do something similar here. This brings to question the ‘Fed put’ narrative and whether we’ll hear Jerome Powell talk up the prospect of softer policy and accommodation later in the year, or whether he’ll take a more hardline stance on the matter.
At this point the index has recovered just about 23.6% of the recent sell-off, and the 38.2% retracement of that move is confluent with the 200-day moving average, so that would present another spot of possible resistance. If prices can punch up to that level, however, there would also be an opening door for recovery themes – provided that the 5638-5670 zone could hold higher-low supports; and that would open the door for a move up to 5824 which is the 50% mark of the recent sell-off.
For bears, the next major area of longer-term support on the chart is the 5340-5402 zone that I had looked at as my ‘s3’ zone in the 2025 forecast for indices.
SPX Four-Hour Chart
Chart prepared by James Stanley; data derived from Tradingview
--- written by James Stanley, Senior Strategist
Related tags:
Latest market news




Open an account in minutes
Experience award-winning platforms with fast and secure execution, and enjoy tight spreads from 0.5 pts on FX and 0.3 pts on indices.
Economic calendar
Web Trader platform
Our sophisticated web-based platform is packed with features.
Related articles
Oil Quietly Hands the Fed a Reason to Stay Hawkish
Oil prices and the U.S. dollar are both on the front foot as elevated energy costs feed Fed warnings that inflation may prove sticky.

S&P 500 forecast: Stocks extend drop as correction risks grow
US and global equity markets have extended Wednesday’s sell-off, with Wall Street opening lower after a weak handover from Asia and Europe. The deterioration in risk appetite has been spreading across global markets. The dollar was firmer, Treasury yields were holding onto yesterday’s gains, while gold, silver and bitcoin were all under pressure alongside equities and major currencies.

Gold forecast: XAU/USD could take a larger dive after the big rise in yields
Gold prices have been falling in the last few days after last week’s post-FOMC pop faded amid rising interest rate expectations, higher oil prices and a strengthening US dollar. As before, I wasn’t convinced gold would thrive in the current macro backdrop.
This report is intended for general circulation only. It should not be construed as a recommendation, or an offer (or solicitation of an offer) to buy or sell any financial products. The information provided does not take into account your specific investment objectives, financial situation or particular needs. Before you act on any recommendation that may be contained in this report, independent advice ought to be sought from a financial adviser regarding the suitability of the investment product, taking into account your specific investment objectives, financial situation or particular needs.
StoneX Financial Pte. Ltd., may distribute reports produced by its respective foreign entities or affiliates within the StoneX group of companies or third parties pursuant to an arrangement under Regulation 32C of the Financial Advisers Regulations. Where the report is distributed to a person in Singapore who is not an accredited investor, expert investor or an institutional investor (as defined in the Securities Futures Act), StoneX Financial Pte. Ltd. accepts legal responsibility to such persons for the contents of the report only to the extent required by law. Singapore recipients should contact StoneX Financial Pte. Ltd. at 6826 9988 for matters arising from, or in connection with the report.
In the case of all other recipients of this report, to the extent permitted by applicable laws and regulations neither StoneX Financial Pte. Ltd. nor its associated companies will be responsible or liable for any loss or damage incurred arising out of, or in connection with, any use of the information contained in this report and all such liability is hereby expressly disclaimed. No representation or warranty is made, express or implied, that the content of this report is complete or accurate.
StoneX Financial Pte. Ltd. is not under any obligation to update this report.
Trading CFDs carries a high level of risk that may not be suitable for some investors. Consider your investment objectives, level of experience, financial resources, risk appetite and other relevant circumstances carefully. The possibility exists that you could lose some or all of your investments, including your initial deposits. If in doubt, please seek independent expert advice. Visit www.forex.com/en-sg/terms-and-policies for the complete Risk Disclosure Statement.