







Squeeeeeeze
The Australian Dollar pairs may be ready for a good, old-fashioned squeeze!
Share this:
Generally, when stocks up, the Australian Dollar goes up with them. Often we refer to the correlation coefficient and how it can be used to help determine the possible direction of one asset based on its correlation with another asset. In this case, the S&P 500 and the AUD/USD have a +.95 correlation coefficient. A correlation of +1.00 means that the 2 assets move perfectly together 100% of the time. Therefore, a correlation coefficient of +.95 is pretty close.
Source: Tradingview, CME, City Index
Notice on the chart above how the S&P 500 is trying to break above the recent highs of 2885 from April 17th. That level is just below the phycological resistance of 2900 and the 61.8% retracement from the February 20th highs to the March 23rd lows at 2933. Think about how many people may have gotten short near these levels. That may actually be the reason stocks pulled back on April 20th and 21st. Now, think about where those traders may have put their stops. Buyers that were in the market on a quiet day may ultimately be trying to push stocks higher to eventually take out those stops! This is known as a squeeze - the market is squeezing the shorts out of the market! (And what a perfect week to try and do it with companies such as AMNZ and MSFT reporting this week)
If someone is looking to trade the S&P 500, either as a long looking for new highs or a short with stops above 2933, but would rather do it via a currency pair, a pair to consider is the AUD/USD. The pair already has a squeeze of its own taking place, which given the correlation coefficient, should help drag stocks higher with it. The AUD/USD has broken through horizontal resistance, prior highs and is currently trading just above the 61.8% Fibonacci retracement level from the December 31st, 2019 highs to the March 18th lows near .6455. The next resistance level about isn’t until .6660.
Source: Tradingview, City Index
Many other Australian Dollar currency pairs are breaking through key levels and could squeeze further. Below are a few examples:
AUD/JPY
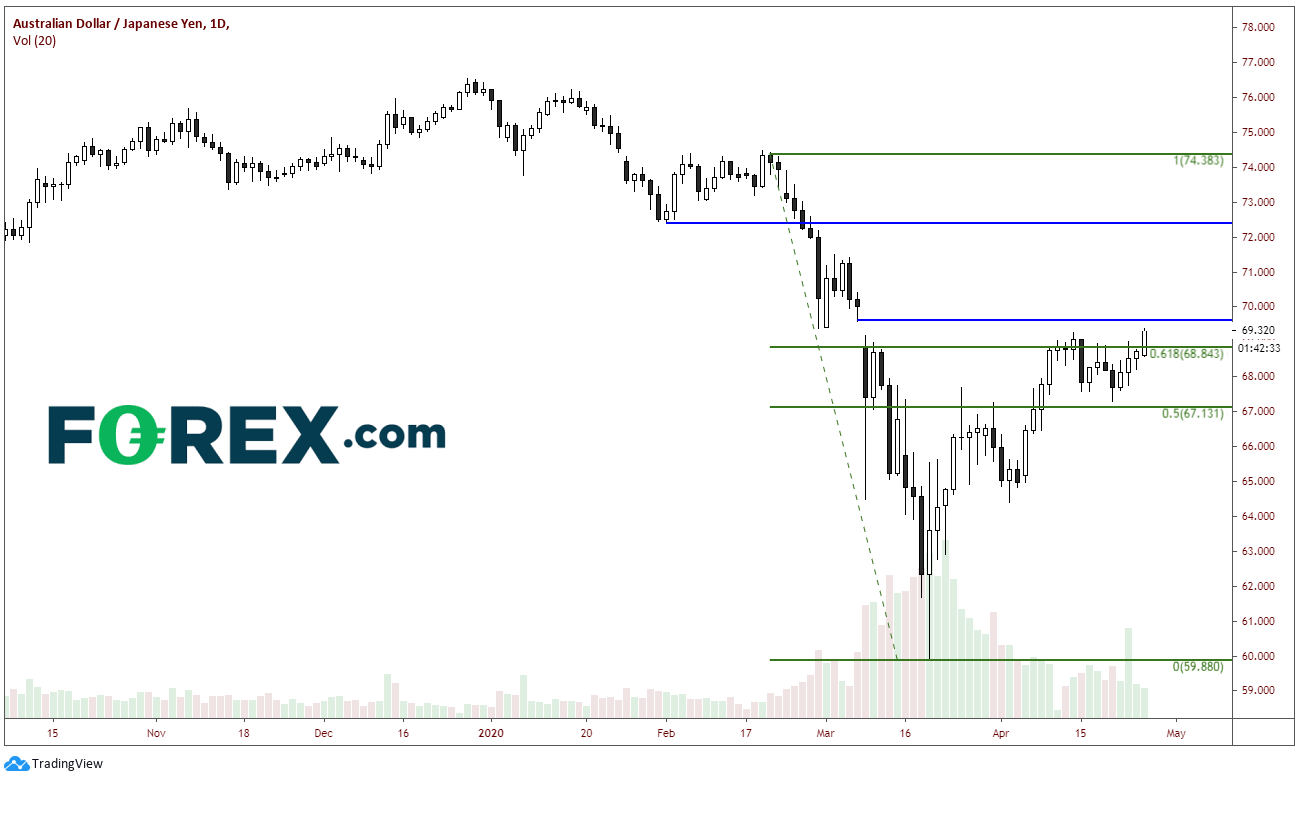
AUD/JPY is trading just above the 61.8% Fibonacci retracement from the highs of February 20th to the lows of March 19th and trying to fill the gap resistance from March 6th near 69.60.
Source: Tradingview, City Index
AUD/CAD
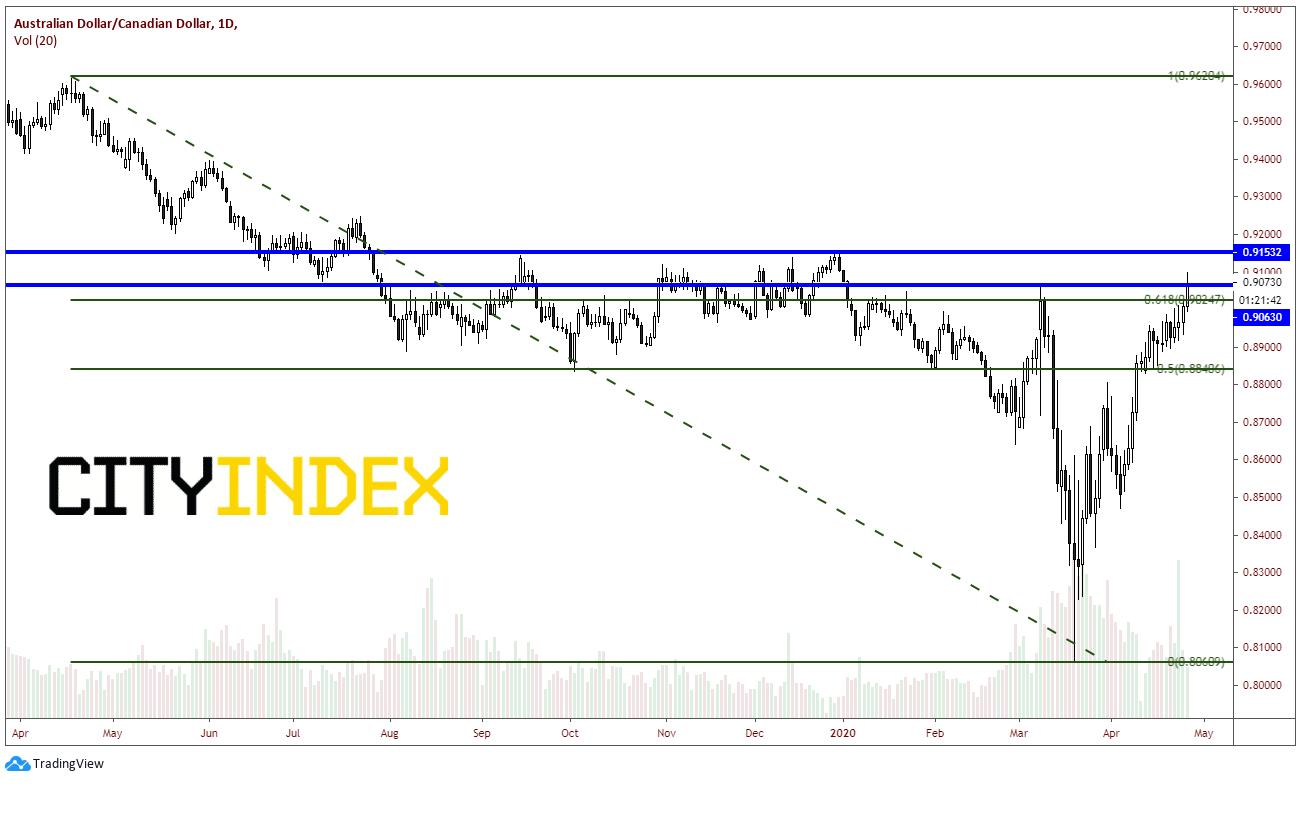
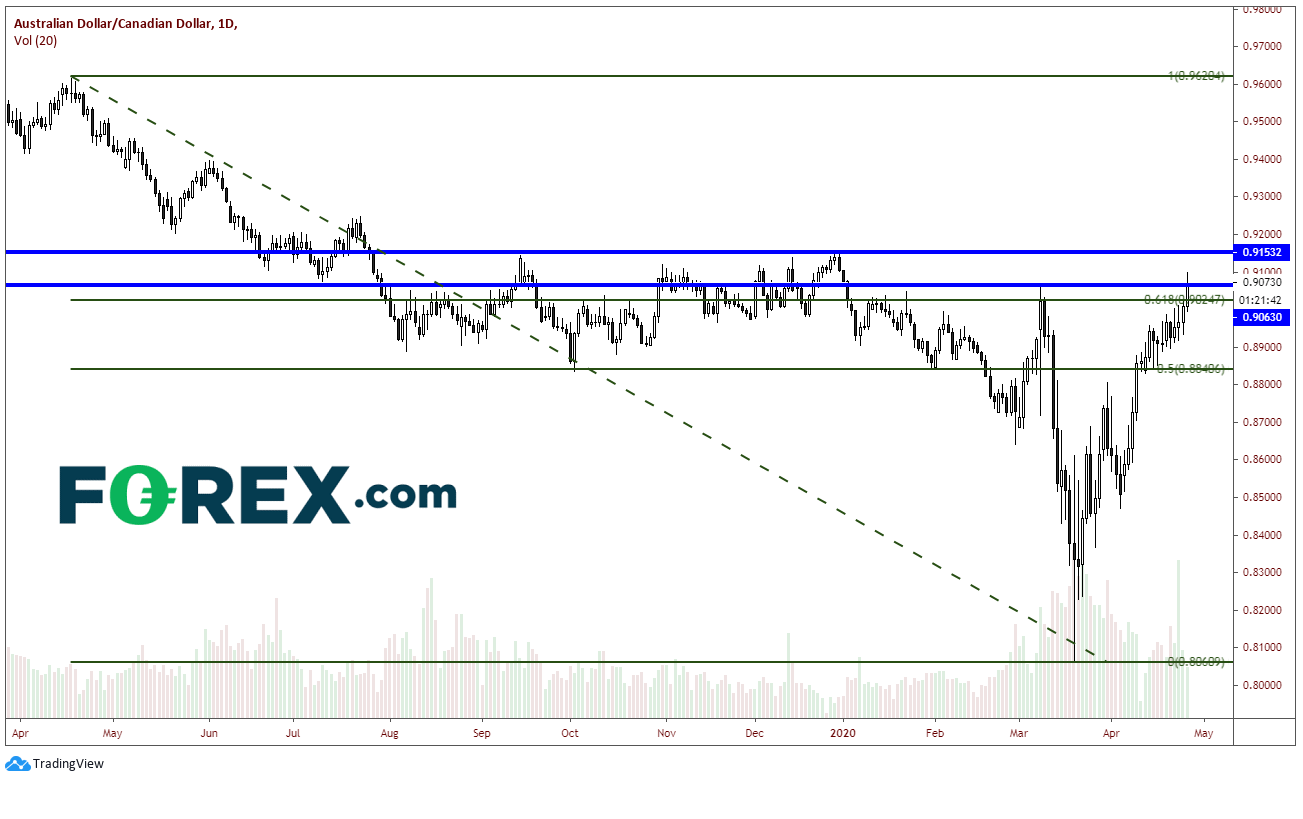
AUD/CAD has broken the 61.8 Fibonacci retracement level from April 17th, 2019 to the lows of March 19th near .9024 and above recent highs from March 9th at .9060. Next resistance level is .9150.
Source: Tradingview, City Index
GBP/AUD
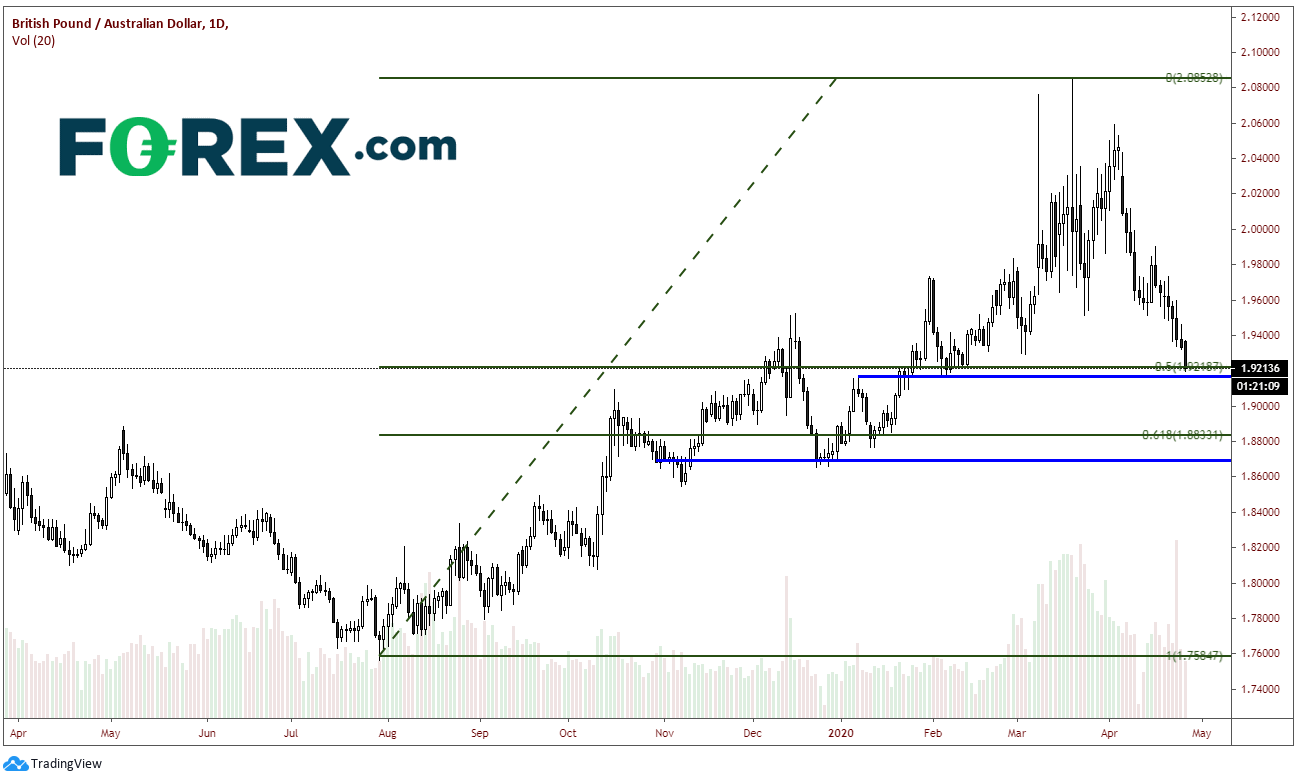
GBP/AUD is currently testing support at the 50% retracement level from the July 29th, 2019 lows to the March 19th highs, near 1.9218. There is immediate horizontal support also at that level. If break breaks lower, if can quickly run down to the 61.8% Fibonacci retracement level from that same timeframe near 1.8833.
Source: Tradingview, City Index
If one is looking to trade the S&P 500, however doesn’t want to expose themselves to the equity markets, the Australian Dollar is a comparative asset to trade. Looking at the Australian Dollar pairs, many are at key levels and may be ready for a good, old-fashioned squeeze!
Generally, when stocks up, the Australian Dollar goes up with them. Often we refer to the correlation coefficient and how it can be used to help determine the possible direction of one asset based on its correlation with another asset. In this case, the S&P 500 and the AUD/USD have a +.95 correlation coefficient. A correlation of +1.00 means that the 2 assets move perfectly together 100% of the time. Therefore, a correlation coefficient of +.95 is pretty close.
Source: Tradingview, CME, FOREX.com
Notice on the chart above how the S&P 500 is trying to break above the recent highs of 2885 from April 17th. That level is just below the phycological resistance of 2900 and the 61.8% retracement from the February 20th highs to the March 23rd lows at 2933. Think about how many people may have gotten short near these levels. That may actually be the reason stocks pulled back on April 20th and 21st. Now, think about where those traders may have put their stops. Buyers that were in the market on a quiet day may ultimately be trying to push stocks higher to eventually take out those stops! This is known as a squeeze - the market is squeezing the shorts out of the market! (And what a perfect week to try and do it with companies such as AMNZ and MSFT reporting this week)
If someone is looking to trade the S&P 500, either as a long looking for new highs or a short with stops above 2933, but would rather do it via a currency pair, a pair to consider is the AUD/USD. The pair already has a squeeze of its own taking place, which given the correlation coefficient, should help drag stocks higher with it. The AUD/USD has broken through horizontal resistance, prior highs and is currently trading just above the 61.8% Fibonacci retracement level from the December 31st, 2019 highs to the March 18th lows near .6455. The next resistance level about isn’t until .6660.
Source: Tradingview, FOREX.com
Many other Australian Dollar currency pairs are breaking through key levels and could squeeze further. Below are a few examples:
AUD/JPY
AUD/JPY is trading just above the 61.8% Fibonacci retracement from the highs of February 20th to the lows of March 19th and trying to fill the gap resistance from March 6th near 69.60.
Source: Tradingview, FOREX.com
AUD/CAD
AUD/CAD has broken the 61.8 Fibonacci retracement level from April 17th, 2019 to the lows of March 19th near .9024 and above recent highs from March 9th at .9060. Next resistance level is .9150.
Source: Tradingview, FOREX.com
GBP/AUD
GBP/AUD is currently testing support at the 50% retracement level from the July 29th, 2019 lows to the March 19th highs, near 1.9218. There is immediate horizontal support also at that level. If break breaks lower, if can quickly run down to the 61.8% Fibonacci retracement level from that same timeframe near 1.8833.
Source: Tradingview, FOREX.com
If one is looking to trade the S&P 500, however doesn’t want to expose themselves to the equity markets, the Australian Dollar is a comparative asset to trade. Looking at the Australian Dollar pairs, many are at key levels and may be ready for a good, old-fashioned squeeze!


Open an account in minutes
Experience award-winning platforms with fast and secure execution, and enjoy tight spreads from 0.5 pts on FX and 0.3 pts on indices.
Economic calendar
Web Trader platform
Our sophisticated web-based platform is packed with features.
Related articles
USD/JPY outlook: Hawkish Fed recalibration pressures the yen
Stronger US growth momentum and rising Treasury yields are keeping USD/JPY pointed higher, even as Japanese policymakers try to limit the pressure building across domestic markets.

AUD/USD Crushed Ahead of Jobs Report as US Dollar, Yields Surge
AUD/USD slumps towards 70c as surging US yields and a stronger dollar overshadow Australian jobs data and the RBA outlook.


USD/MXN Forecast: Peso Loses Momentum Ahead of Banxico Decision
Over recent trading sessions, the Mexican peso has started to show signs of losing strength against the U.S. dollar. This can be seen in the performance of USD/MXN, which has gained more than 1.7% over the last three sessions, highlighting the dollar's renewed strength against the peso.

This report is intended for general circulation only. It should not be construed as a recommendation, or an offer (or solicitation of an offer) to buy or sell any financial products. The information provided does not take into account your specific investment objectives, financial situation or particular needs. Before you act on any recommendation that may be contained in this report, independent advice ought to be sought from a financial adviser regarding the suitability of the investment product, taking into account your specific investment objectives, financial situation or particular needs.
StoneX Financial Pte. Ltd., may distribute reports produced by its respective foreign entities or affiliates within the StoneX group of companies or third parties pursuant to an arrangement under Regulation 32C of the Financial Advisers Regulations. Where the report is distributed to a person in Singapore who is not an accredited investor, expert investor or an institutional investor (as defined in the Securities Futures Act), StoneX Financial Pte. Ltd. accepts legal responsibility to such persons for the contents of the report only to the extent required by law. Singapore recipients should contact StoneX Financial Pte. Ltd. at 6826 9988 for matters arising from, or in connection with the report.
In the case of all other recipients of this report, to the extent permitted by applicable laws and regulations neither StoneX Financial Pte. Ltd. nor its associated companies will be responsible or liable for any loss or damage incurred arising out of, or in connection with, any use of the information contained in this report and all such liability is hereby expressly disclaimed. No representation or warranty is made, express or implied, that the content of this report is complete or accurate.
StoneX Financial Pte. Ltd. is not under any obligation to update this report.
Trading CFDs carries a high level of risk that may not be suitable for some investors. Consider your investment objectives, level of experience, financial resources, risk appetite and other relevant circumstances carefully. The possibility exists that you could lose some or all of your investments, including your initial deposits. If in doubt, please seek independent expert advice. Visit www.forex.com/en-sg/terms-and-policies for the complete Risk Disclosure Statement.