



Top Lesson of 2025 – Gold
Gold’s explosive 2025 rally broke every traditional rule of momentum and market psychology. Here’s are key lessons for traders to carry into 2026.
Share this:

2025 delivered one of the clearest trading lessons of the decade: in a parabolic trend, overbought is not a sell signal. Shorting Gold without protection became one of the heaviest burdens traders carried this year, as the metal surged an unprecedented +64%, repeatedly defying historic RSI extremes and conventional momentum logic.
Gold opened 2025 near 2624, rallied almost 900 points into the 3500 high, consolidated for five months into a tight continuation structure, then launched another 900-point leg toward 4400. Trend followers and hedge traders navigating the new Trump policy cycle captured exponential upside. But for short sellers anchored to the idea of “overheating,” the relentless rise pushed portfolios to breaking points — not via reversals, but through brief consolidations that simply reset the uptrend.
This raised a deeper question for global investors: How high can Gold go? And what does that imply about confidence in today’s monetary and financial architecture?
Gold, US 500 Monthly Time Frame - Log Scale

Source: Trading view
For the first time in years, the positive correlation between Gold and US equity indices strengthened, sending both assets on synchronized exponential rises. Gold fulfilled a dual role:
- A safe haven during geopolitical shocks
- A liquidity beneficiary during risk-on expansion
A softer US Dollar, dovish policy expectations entering the Trump administration, and persistent central bank accumulation all reinforced the bullish cycle. This combination kept Gold almost exclusively in uptrend or consolidation mode, effectively suspending traditional overbought principles across 2025.
Will a proper correction emerge? Probably, with confirmation from major monthly technical levels.
Key Technical Structures and Lessons Ahead
Gold Monthly Time Frame – Log Scale
Source: Trading view
Cup & Handle Completion
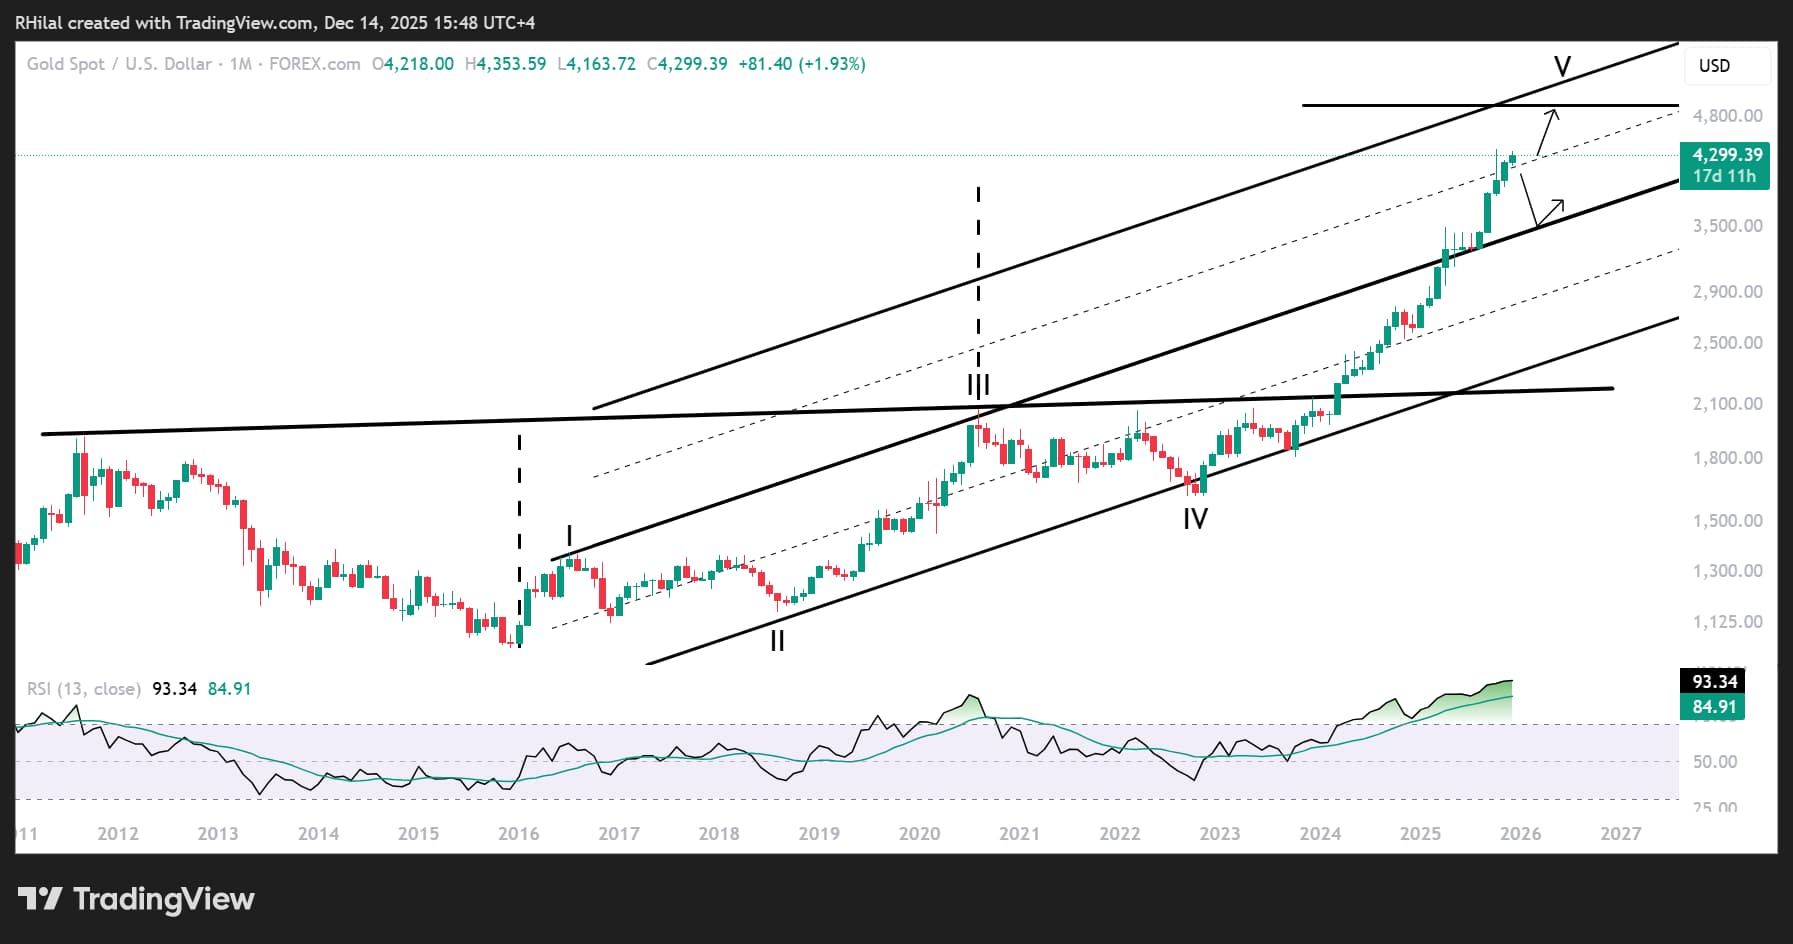
Gold’s nearly 4400 peak — accompanied by a record 93 RSI — aligns with the measured move of a decade-long cup and handle formation extending back to 2011. This marks a natural exhaustion and reaction zone.
Duplicated Channel Mid-Zone
Price has reached the mid-point of a duplicated channel framing Gold’s primary structure from 2016 to 2025. Historically, mid-zones act as equilibrium areas where markets pause, consolidate, or retrace before the next structural move.
But as the saying goes, the trend is your friend until a confirmed reversal emerges. As long as Gold continues to break through psychological and structural resistance levels, the broader bullish framework remains intact.
Market consensus, including major US banks, increasingly points toward a $5,000 target. This scenario becomes viable if Gold delivers a sustained monthly close above the 4,400 breakout zone, which would open the path toward the upper boundary of the duplicated long-term channel near the 5k region.
However, Gold is currently positioned near a neutral mid-channel zone, where trend hesitation or corrective phases often develop. A drawdown toward the 3700–3500 channel support area remains a realistic risk before the next leg higher. Such a move would not invalidate the primary uptrend but would require careful monitoring of trend shifts and key breakouts to avoid bull traps, bear traps, and prolonged consolidation structures. For now, 3900 stands as the pivotal support level; losing it would be the first meaningful indication of deeper corrective pressure.
Written by Razan Hilal, CMT
Follow on X: @Rh_waves
Related tags:
Latest market news




Open an account in minutes
Experience award-winning platforms with fast and secure execution, and enjoy tight spreads from 0.5 pts on FX and 0.3 pts on indices.
Economic calendar
Web Trader platform
Our sophisticated web-based platform is packed with features.
Related articles
Gold Q4 2026 outlook: Resilience in the face of rallying dollar and yields
As we headed towards the latter stages of Q3 and into Q4, the Fed had just hiked rates in a hawkish FOMC meeting, while the likes of the ECB and BoJ had also tightened their respective policies. Oil prices remained elevated amid the prolonged US-Iran conflict. Meanwhile, bond yields were breaking out, and the dollar was higher across the board. Yet, remarkably, gold was still holding in the positive territory for the third quarter, even if it had weakened somewhat in September.
EUR/USD Q4 2026 Outlook: Euro at a Crossroads as Fed, ECB Tighten 9 25 2026
EUR/USD enters Q4 at a pivotal inflection point as competing Fed-ECB policy paths and persistent inflation risks collide with major technical support.


USD/JPY Q4 2026 Outlook: Hawkish Fed Pricing Clashes With Intervention Risk
The year-end tug-of-war is clear: hawkish Fed pricing supports USD/JPY, while intervention risk limits the upside.

This report is intended for general circulation only. It should not be construed as a recommendation, or an offer (or solicitation of an offer) to buy or sell any financial products. The information provided does not take into account your specific investment objectives, financial situation or particular needs. Before you act on any recommendation that may be contained in this report, independent advice ought to be sought from a financial adviser regarding the suitability of the investment product, taking into account your specific investment objectives, financial situation or particular needs.
StoneX Financial Pte. Ltd., may distribute reports produced by its respective foreign entities or affiliates within the StoneX group of companies or third parties pursuant to an arrangement under Regulation 32C of the Financial Advisers Regulations. Where the report is distributed to a person in Singapore who is not an accredited investor, expert investor or an institutional investor (as defined in the Securities Futures Act), StoneX Financial Pte. Ltd. accepts legal responsibility to such persons for the contents of the report only to the extent required by law. Singapore recipients should contact StoneX Financial Pte. Ltd. at 6826 9988 for matters arising from, or in connection with the report.
In the case of all other recipients of this report, to the extent permitted by applicable laws and regulations neither StoneX Financial Pte. Ltd. nor its associated companies will be responsible or liable for any loss or damage incurred arising out of, or in connection with, any use of the information contained in this report and all such liability is hereby expressly disclaimed. No representation or warranty is made, express or implied, that the content of this report is complete or accurate.
StoneX Financial Pte. Ltd. is not under any obligation to update this report.
Trading CFDs carries a high level of risk that may not be suitable for some investors. Consider your investment objectives, level of experience, financial resources, risk appetite and other relevant circumstances carefully. The possibility exists that you could lose some or all of your investments, including your initial deposits. If in doubt, please seek independent expert advice. Visit www.forex.com/en-sg/terms-and-policies for the complete Risk Disclosure Statement.