








Treasury Breakout Reshapes Markets: Gold Roars, USD/CHF Stumbles
Bond bulls just kicked the door down. US Yields are sinking, gold is soaring, and USD/CHF is on the ropes. What happens next?
Share this:

- US bonds rip higher, 10-year yields dive
- Gold charges to fresh records, no topping signals yet
- USD/CHF cracks key support, downside risk builds
- Payrolls data the next big test
Summary
US long bonds staged a dramatic bullish breakout on Wednesday, sending benchmark 10-year Treasury yields careening to fresh year-to-date lows. With technicals aligning with restricted supply and signs of spluttering US economic data, the backdrop looks favourable for assets sensitive to long-term interest rates. This report will examine the implications for two key yield-sensitive plays: gold and the Swiss franc.
Bond Bulls Take Control
Before diving into the technical signals for those assets, we start with US 10-year Treasury note futures, one of the most liquid futures contracts globally. Like any price chart, technicals provide a useful tool to gauge directional risks for benchmark US Treasuries. And since bond prices move inversely to yields, the same applies to key US 10-year bond yields.
Source: TradingView
Wednesday delivered a definitive price signal, with futures surging through a key resistance zone on strong volumes. This was helped by signs of softening demand at US services firms and the US government keeping long-dated Treasury issuance unchanged in its quarterly refunding announcement (QRA), ensuring a restricted supply of long bonds relative to demand.
The price had been knocking on the door of this resistance zone for weeks, mirroring previous interactions in late December and early November when it acted as support. Some may describe the recent price action as an inverse head and shoulders pattern, but what matters is this breakout finally stuck. With RSI (14) and MACD flashing bullish momentum signals, risks appear skewed towards further gains ahead—meaning lower 10-year yields.
I've marked the next topside levels of interest on the chart, sparing you an explanation of bond pricing, which this scribe does not have time for right now! If those levels give way, there’s not much visible resistance until the swing highs from early December.
From a fundamental standpoint, Friday’s US payrolls report looms large following the breakout, with the unemployment rate and payrolls figure—including revisions—particularly important.
Long Bond Yields Matter for Markets
The broader market implications are captured in the chart below, tracking rolling 20-day correlation scores between US 10-year Treasury note futures and various markets across FX, stocks, crypto, and precious metals.
Source: TradingView
While not every asset has shown a strong positive or inverse relationship in the past month, many—such as the Japanese yen, Dow futures, and gold—have. Even though USD/CHF’s inverse correlation hasn’t been overly strong at -0.77, it’s significantly higher over longer timeframes.
USD/JPY was covered separately on Wednesday, with downside risks from compressing yield differentials playing out nicely. With nothing new to add there for now, focus instead shifts to high-flying gold and USD/CHF.
USD/CHF: Bearish Signals Stacking Up
Source: TradingView
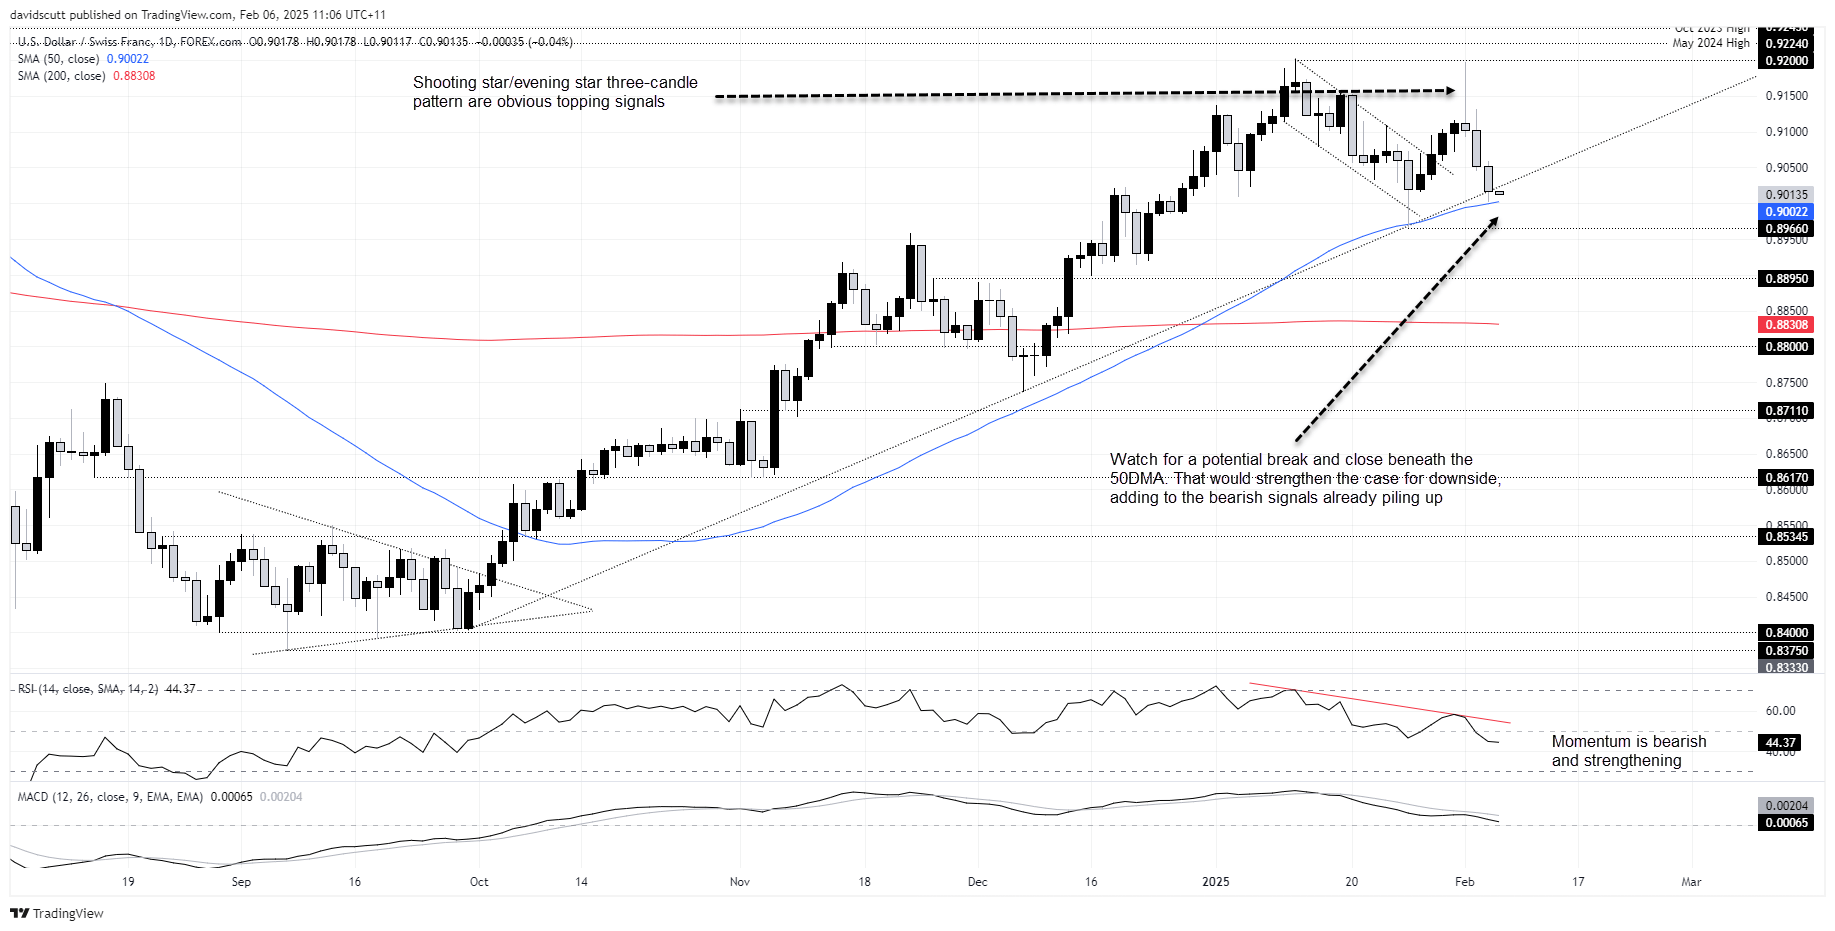
USD/CHF is flashing multiple bearish signals on the daily chart, with Monday’s shooting star candle—formed after failing to break January’s highs—coinciding with further declines over the past two days, completing a three-candle evening star pattern in the process.
The price is now hovering just above the 50-day moving average after breaking below uptrend support from late September. Given the 50DMA has often acted as a key level, a decisive break below it could accelerate downside risks. RSI (14) and MACD are reinforcing bearish momentum, adding weight to the deteriorating picture.
If USD/CHF breaks and closes beneath the 50DMA, those eying bearish setups could establish shorts beneath with a stop above former uptrend support for protection. The January low of 0.8966 stands as a near-term hurdle for those seeking better risk-reward, making it a key level to watch. Failure to break this minor support may require a rethink, but if it gives way, the door could open for a move towards 0.8900 where bids emerged in late December.
For those targeting a more extended move, the price saw plenty of action around 0.8800 in late 2024, putting that level in play. The 200DMA is another worth pondering.
Gold: Bulls in Control, No Topping Signals Yet
Source: TradingView
Gold has kicked off 2025 in full-blown bull mode, with falling US bond yields and a softening dollar acting like a pressure release for an already bullish setup.
While RSI (14) has entered overbought territory on the daily timeframe, recent history suggests that hasn’t been much of an obstacle for further upside. Both RSI and MACD are generating strong bullish momentum signals—something to be cautious of when chasing gains, but not outright bearish.
Rather than offering speculative extension targets, the preference remains to wait for a clear topping signal before scaling back longs or considering shorts. None are evident yet, and in the meantime, dips are likely to be bought.
Technically, there are few reference points at these levels, with support at the former record high of $2790 and potential resistance where Wednesday’s bullish thrust stalled.
-- Written by David Scutt
Follow David on Twitter @scutty
How to trade with City Index
You can trade with City Index by following these four easy steps:
- Open an account, or log in if you’re already a customer
• Open an account in the UK
• Open an account in Australia
• Open an account in Singapore
- Search for the market you want to trade in our award-winning platform
- Choose your position and size, and your stop and limit levels
- Place the trade
Related tags:
Latest market news



Open an account in minutes
Experience award-winning platforms with fast and secure execution, and enjoy tight spreads from 0.5 pts on FX and 0.3 pts on indices.
Economic calendar
Web Trader platform
Our sophisticated web-based platform is packed with features.
Related articles
EUR/USD weekly outlook: Oil, inflation and NFP in focus
After coming under significant pressure in recent weeks, the EUR/USD came off its lows to finish the week on a positive note on Friday, albeit with only a mild rebound. That was not enough to prevent the exchange rate falling for the third consecutive week, as the US dollar and bond yields rallied across the board.

Gold Price Forecast: XAU/USD Avoids Breakdown as Yields Surged but Can it Continue?
Surging Treasury yields sent a jolt across markets last week but, so far, gold prices have held above the FOMC low. The big question now is whether that can continue and, if not, will bulls show up at $4100 or $4k like they did in June and July?

Gold Q4 2026 outlook: Resilience in the face of rallying dollar and yields
As we headed towards the latter stages of Q3 and into Q4, the Fed had just hiked rates in a hawkish FOMC meeting, while the likes of the ECB and BoJ had also tightened their respective policies. Oil prices remained elevated amid the prolonged US-Iran conflict. Meanwhile, bond yields were breaking out, and the dollar was higher across the board. Yet, remarkably, gold was still holding in the positive territory for the third quarter, even if it had weakened somewhat in September.
This report is intended for general circulation only. It should not be construed as a recommendation, or an offer (or solicitation of an offer) to buy or sell any financial products. The information provided does not take into account your specific investment objectives, financial situation or particular needs. Before you act on any recommendation that may be contained in this report, independent advice ought to be sought from a financial adviser regarding the suitability of the investment product, taking into account your specific investment objectives, financial situation or particular needs.
StoneX Financial Pte. Ltd., may distribute reports produced by its respective foreign entities or affiliates within the StoneX group of companies or third parties pursuant to an arrangement under Regulation 32C of the Financial Advisers Regulations. Where the report is distributed to a person in Singapore who is not an accredited investor, expert investor or an institutional investor (as defined in the Securities Futures Act), StoneX Financial Pte. Ltd. accepts legal responsibility to such persons for the contents of the report only to the extent required by law. Singapore recipients should contact StoneX Financial Pte. Ltd. at 6826 9988 for matters arising from, or in connection with the report.
In the case of all other recipients of this report, to the extent permitted by applicable laws and regulations neither StoneX Financial Pte. Ltd. nor its associated companies will be responsible or liable for any loss or damage incurred arising out of, or in connection with, any use of the information contained in this report and all such liability is hereby expressly disclaimed. No representation or warranty is made, express or implied, that the content of this report is complete or accurate.
StoneX Financial Pte. Ltd. is not under any obligation to update this report.
Trading CFDs carries a high level of risk that may not be suitable for some investors. Consider your investment objectives, level of experience, financial resources, risk appetite and other relevant circumstances carefully. The possibility exists that you could lose some or all of your investments, including your initial deposits. If in doubt, please seek independent expert advice. Visit www.forex.com/en-sg/terms-and-policies for the complete Risk Disclosure Statement.