





Two trades to watch EURGBP WTI oil
EUR/GBP struggles for direction post UK retail sales, EZ CPI final reading up next. WTI oil edges lower but set for strong weekly gains. Baker Hughes rig count in focus.
Share this:

EUR/GBP struggles for direction post UK retail sales, EZ CPI final next
UK retail sales ex fuel unexpectedly declined in August. Sales dropped -0.9% YoY, down from a 1.8% rise in July. Analysts had been expecting a 2.5% increase.
Monthly retail sales ex fuel fell -1.2% in August after falling -2.4% in July.
Looking ahead Eurozone CPI data is due, the final reading for August. Given that this is a final reading it is not expected to have a huge impact on the Euro unless the print is significantly different from the initial 3% YoY figure.
Learn more about trading the Pound
Where next for EUR/GBP?
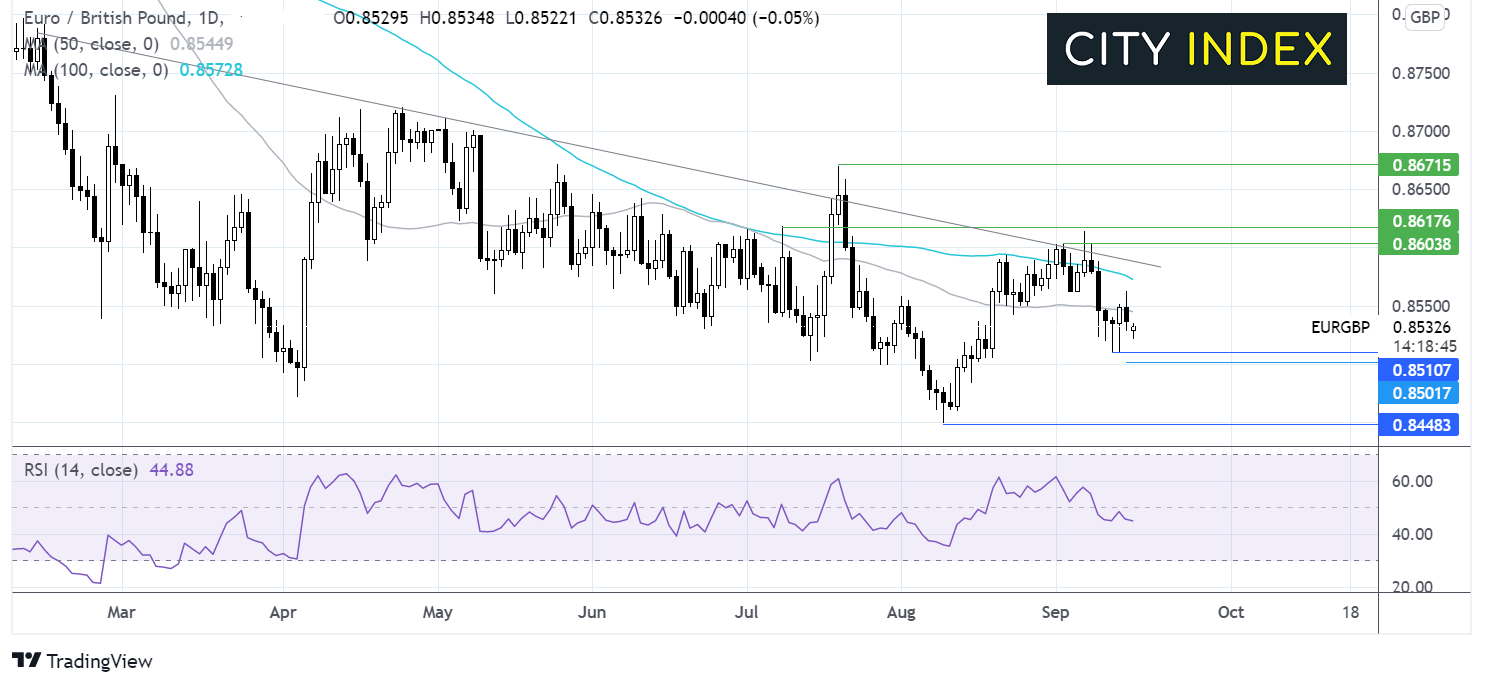
EURGBP is holding steady after two straight days of declines. The move below the 50 sma on the daily chart combined with a bearish RSI is keeping sellers optimistic of further downside. However, the doji candles suggests traders are indecisive as to the next move.
Any move lower could run into support in the 0.8511 – 0.8503 zone, with a meaning break here bringing 0.845 low August 16 into focus.
Any meaningful recovery will need to retake the 50 sma at 0.8544. A push above this level could see the near term bias change in favor of the buyers, bringing the 100 sma at 0.8572 and 0.8585 the falling trendline resistance into focus.
Oil ticks lower but set for strong weekly gains -Baker Hughes rig count in focus
Oil is ticking mildly lower on Friday but is still set for weekly gains in the region of 3.8%. This would mark the fourth straight week of gains with oil prices up over almost 15% from its August 23 low.
This week concerns over the slow return of supply in the US after hurricane Ida resulting in much larger than expected drawdown in inventories has boosted the price, in addition to the energy crisis in Europe.
Supply is now returning which explains the slight dip in prices in early trade. However, more broadly speaking demand is expected to continue outstripping demand as per the IEA& OPEC reports
Baker Hughes rig count data will be in focus after the number of US rigs rose last week.
Where next for WTI crude oil ?
Crude oil pushed over its 50 & 100 sma and multi-month falling trendline and has extended gains across the week. The sustained move above these resistance turned support, combined with a bullish MACD is keeping the bulls hopeful.
It would take a move below 69.50 for sellers to gain traction and the bias to turn bearish.
Meanwhile buyers will want to see a break over the weekly high of 7295 in order to bring 7370 the August high into focus.
How to trade with FOREX.com
Follow these easy steps to start trading with FOREX.com today:
- Open a Forex.com account, or log-in if you’re already a customer.
- Search for the market you want to trade in our award-winning platform.
- Choose your position and size, and your stop and limit levels.
- Place the trade.
EUR/GBP struggles for direction post UK retail sales, EZ CPI final next
UK retail sales ex fuel unexpectedly declined in August. Sales dropped -0.9% YoY, down from a 1.8% rise in July. Analysts had been expecting a 2.5% increase.
Monthly retail sales ex fuel fell -1.2% in August after falling -2.4% in July.
Looking ahead Eurozone CPI data is due, the final reading for August. Given that this is a final reading it is not expected to have a huge impact on the Euro unless the print is significantly different from the initial 3% YoY figure.
Learn more about trading the Pound
Where next for EUR/GBP?
EURGBP is holding steady after two straight days of declines. The move below the 50 sma on the daily chart combined with a bearish RSI is keeping sellers optimistic of further downside. However, the doji candles suggests traders are indecisive as to the next move.
Any move lower could run into support in the 0.8511 – 0.8503 zone, with a meaning break here bringing 0.845 low August 16 into focus.
Any meaningful recovery will need to retake the 50 sma at 0.8544. A push above this level could see the near term bias change in favor of the buyers, bringing the 100 sma at 0.8572 and 0.8585 the falling trendline resistance into focus.
Oil ticks lower but set for strong weekly gains -Baker Hughes rig count in focus
Oil is ticking mildly lower on Friday but is still set for weekly gains in the region of 3.8%. This would mark the fourth straight week of gains with oil prices up over almost 15% from its August 23 low.
This week concerns over the slow return of supply in the US after hurricane Ida resulting in much larger than expected drawdown in inventories has boosted the price, in addition to the energy crisis in Europe.
Supply is now returning which explains the slight dip in prices in early trade. However, more broadly speaking demand is expected to continue outstripping demand as per the IEA& OPEC reports
Baker Hughes rig count data will be in focus after the number of US rigs rose last week.
Where next for WTI crude oil ?
Crude oil pushed over its 50 & 100 sma and multi-month falling trendline and has extended gains across the week. The sustained move above these resistance turned support, combined with a bullish MACD is keeping the bulls hopeful.
It would take a move below 69.50 for sellers to gain traction and the bias to turn bearish.
Meanwhile buyers will want to see a break over the weekly high of 7295 in order to bring 7370 the August high into focus.
How to trade with City Index
Follow these easy steps to start trading with City Index today:
- Open a City Index account, or log-in if you’re already a customer.
- Search for the market you want to trade in our award-winning platform.
- Choose your position and size, and your stop and limit levels
- Place the trade.


Open an account in minutes
Experience award-winning platforms with fast and secure execution, and enjoy tight spreads from 0.5 pts on FX and 0.3 pts on indices.
Economic calendar
Web Trader platform
Our sophisticated web-based platform is packed with features.
Related articles

Oil, USD/JPY Forecast: Two trades to watch
Oil recovers above $90 amid a lack of progress in US-Iran diplomacy. USD/JPY rises to 158 on widening Fed-BoJ policy outlook.
WTI Crude Oil Mulls Bounce from $90
Having fallen 17% from its cycle highs in just five days and now holding above $90, perhaps it could be time for crude oil to bounce over the near term.


Wall Street Forecast: DJIA rises on hawkish Fed expectations & rising yields
U.S. stocks are opening lower on Wednesday, pressured by higher crude oil prices and rising government bond yields, as investors await further developments from negotiations in the Middle East and ahead of a key U.S.-China summit.
This report is intended for general circulation only. It should not be construed as a recommendation, or an offer (or solicitation of an offer) to buy or sell any financial products. The information provided does not take into account your specific investment objectives, financial situation or particular needs. Before you act on any recommendation that may be contained in this report, independent advice ought to be sought from a financial adviser regarding the suitability of the investment product, taking into account your specific investment objectives, financial situation or particular needs.
StoneX Financial Pte. Ltd., may distribute reports produced by its respective foreign entities or affiliates within the StoneX group of companies or third parties pursuant to an arrangement under Regulation 32C of the Financial Advisers Regulations. Where the report is distributed to a person in Singapore who is not an accredited investor, expert investor or an institutional investor (as defined in the Securities Futures Act), StoneX Financial Pte. Ltd. accepts legal responsibility to such persons for the contents of the report only to the extent required by law. Singapore recipients should contact StoneX Financial Pte. Ltd. at 6826 9988 for matters arising from, or in connection with the report.
In the case of all other recipients of this report, to the extent permitted by applicable laws and regulations neither StoneX Financial Pte. Ltd. nor its associated companies will be responsible or liable for any loss or damage incurred arising out of, or in connection with, any use of the information contained in this report and all such liability is hereby expressly disclaimed. No representation or warranty is made, express or implied, that the content of this report is complete or accurate.
StoneX Financial Pte. Ltd. is not under any obligation to update this report.
Trading CFDs carries a high level of risk that may not be suitable for some investors. Consider your investment objectives, level of experience, financial resources, risk appetite and other relevant circumstances carefully. The possibility exists that you could lose some or all of your investments, including your initial deposits. If in doubt, please seek independent expert advice. Visit www.forex.com/en-sg/terms-and-policies for the complete Risk Disclosure Statement.