





US semiconductor stocks significant pullback soon before new upleg
U.S. semiconductor sector(SOXX) may see a further push up ahead of Phase 1 deal sign-off before significant pull-back takes place.
Share this:

Medium-term technical on iShares PHLX Semiconductor (SOXX)
click to enlarge charts
Key Levels (1 to 3 months)
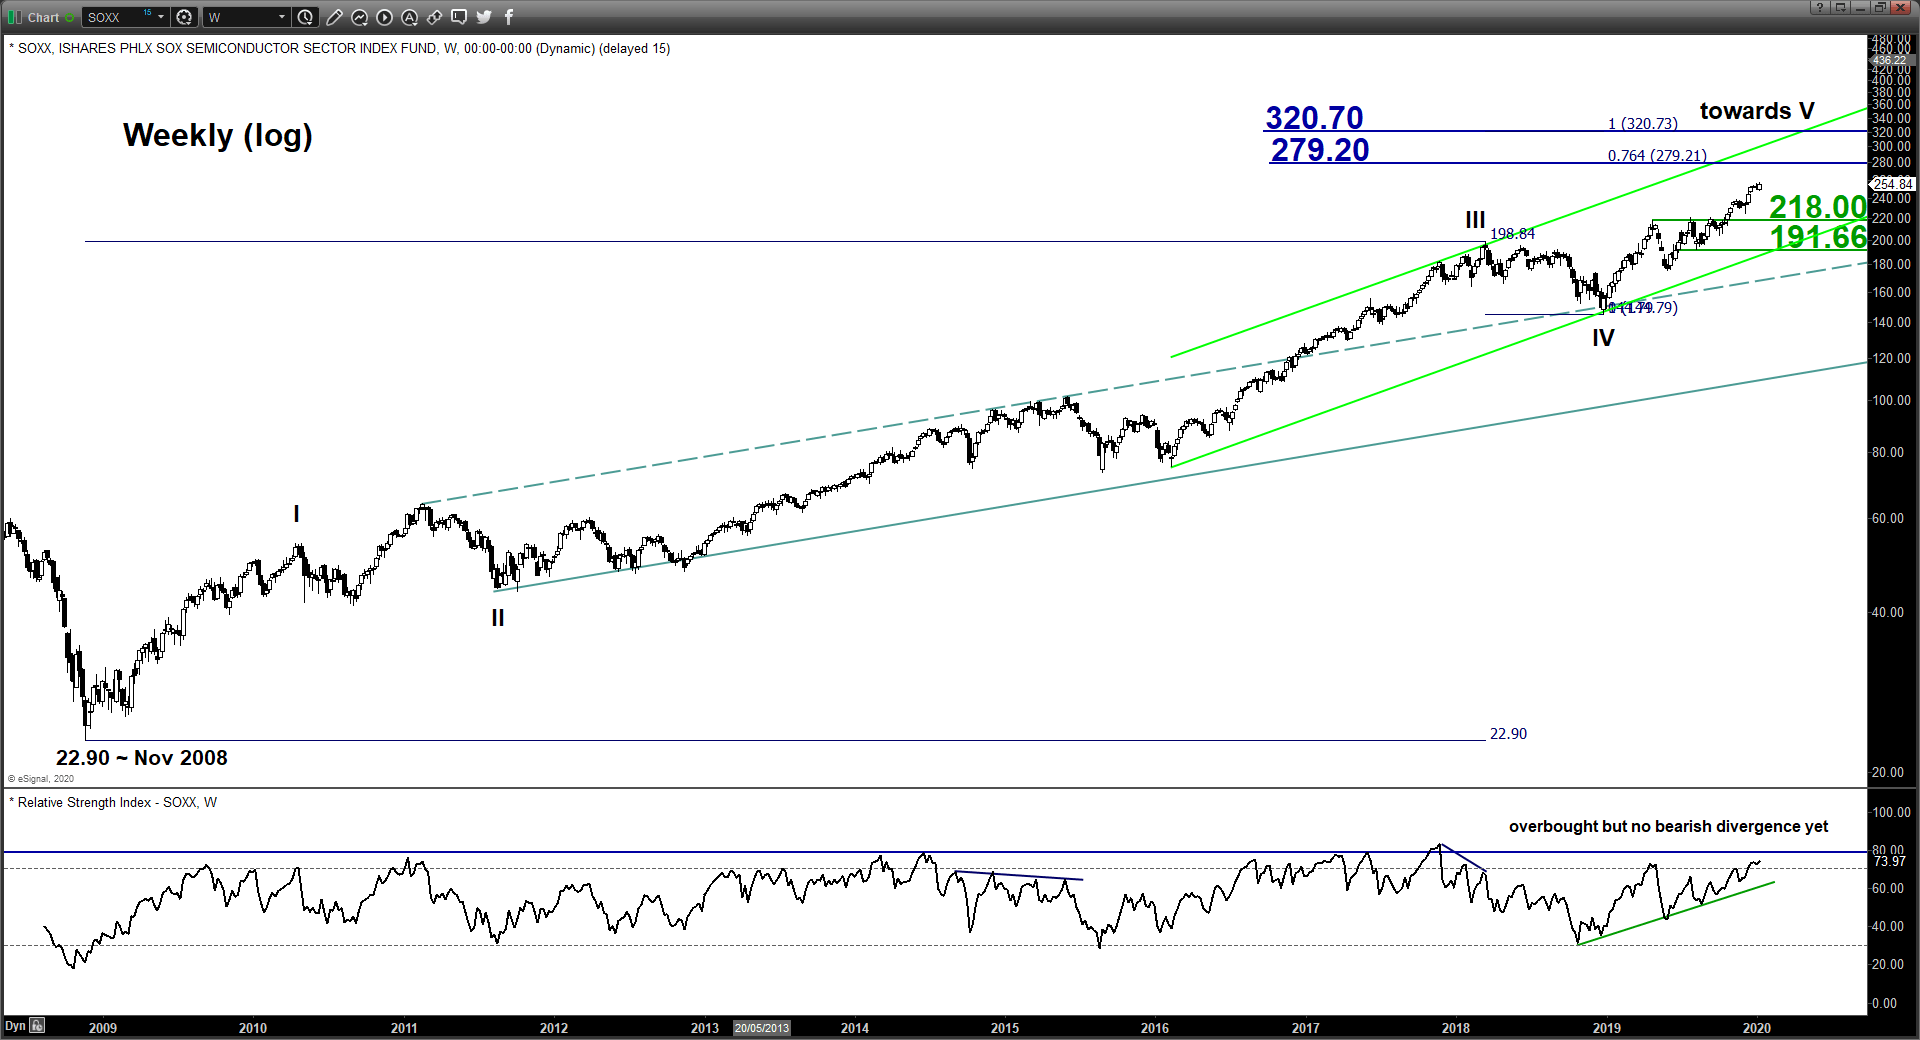
Intermediate support: 247.10
Pivot (key support): 237.85
Resistances: 265.10/55 & 276.25/279.20
Next support: 218.00 (major)
Directional Bias (1 to 3 months)
Major uptrend of the SOXX in place since 26 Dec 2018 low of 144.79 remains intact. Right now, with U.S-Iran skirmish on the back burner, the focus with now turn towards U.S.-China diplomatic trade relations.
China has confirmed that Vice Premier Liu He, the top trade negotiator/special envoy will be heading to U.S. on 13 Jan to sign-off the official Phase One trade deal in the White House on 15 Jan. Risk assets such as stocks have staged a strong push up yesterday, 09 Jan with all the major U.S. benchmark stock indices (S&P 500, Nasdaq 100 & DJIA) hitting another fresh all-time highs. In fact, this piece of positive news flow is not a surprise as the Phase One trade deal agreement has already been made in the “limelight” since 12 Dec 2019 where the U.S. administration has agreed to the terms in principal with a suspension on a new wave of 15% U.S. tariffs on about US$160 billion of Chinese consumer goods that was scheduled to take effect on 15 Dec 2019. In return, China suspended additional tariffs on U.S. farm and automobiles products.
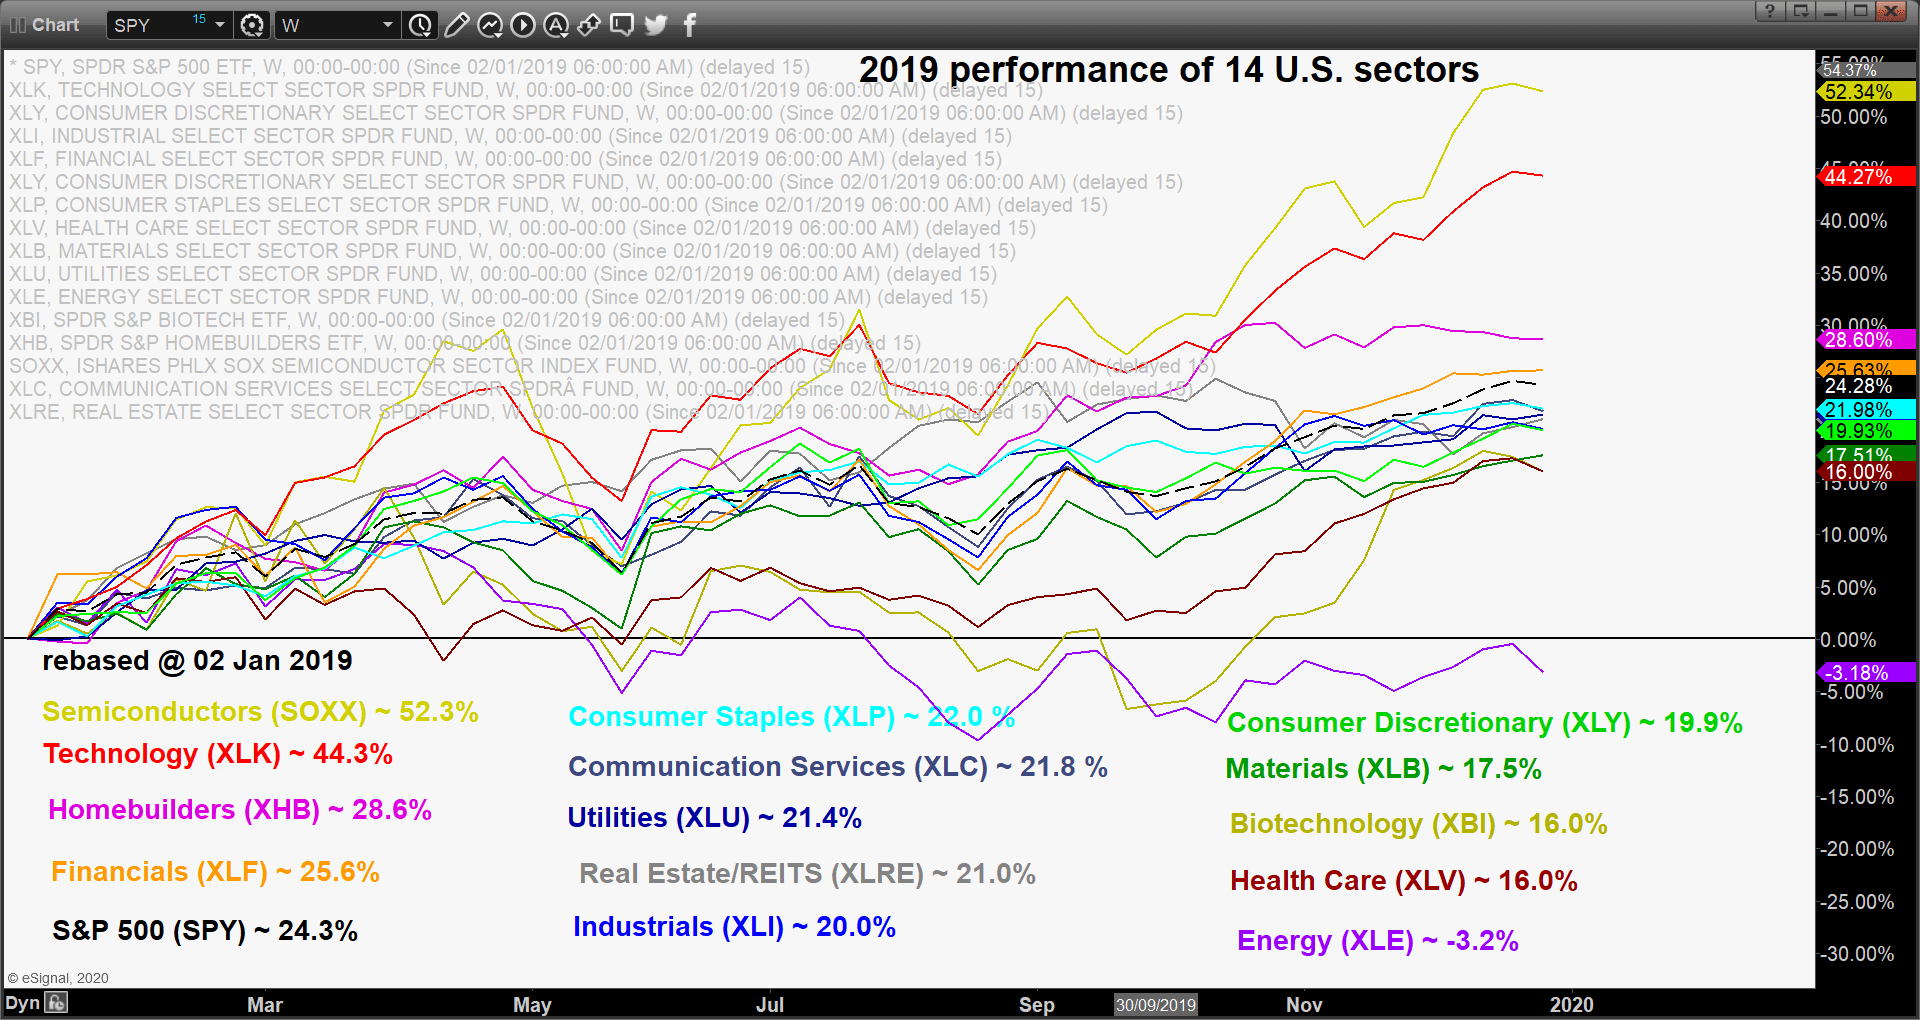
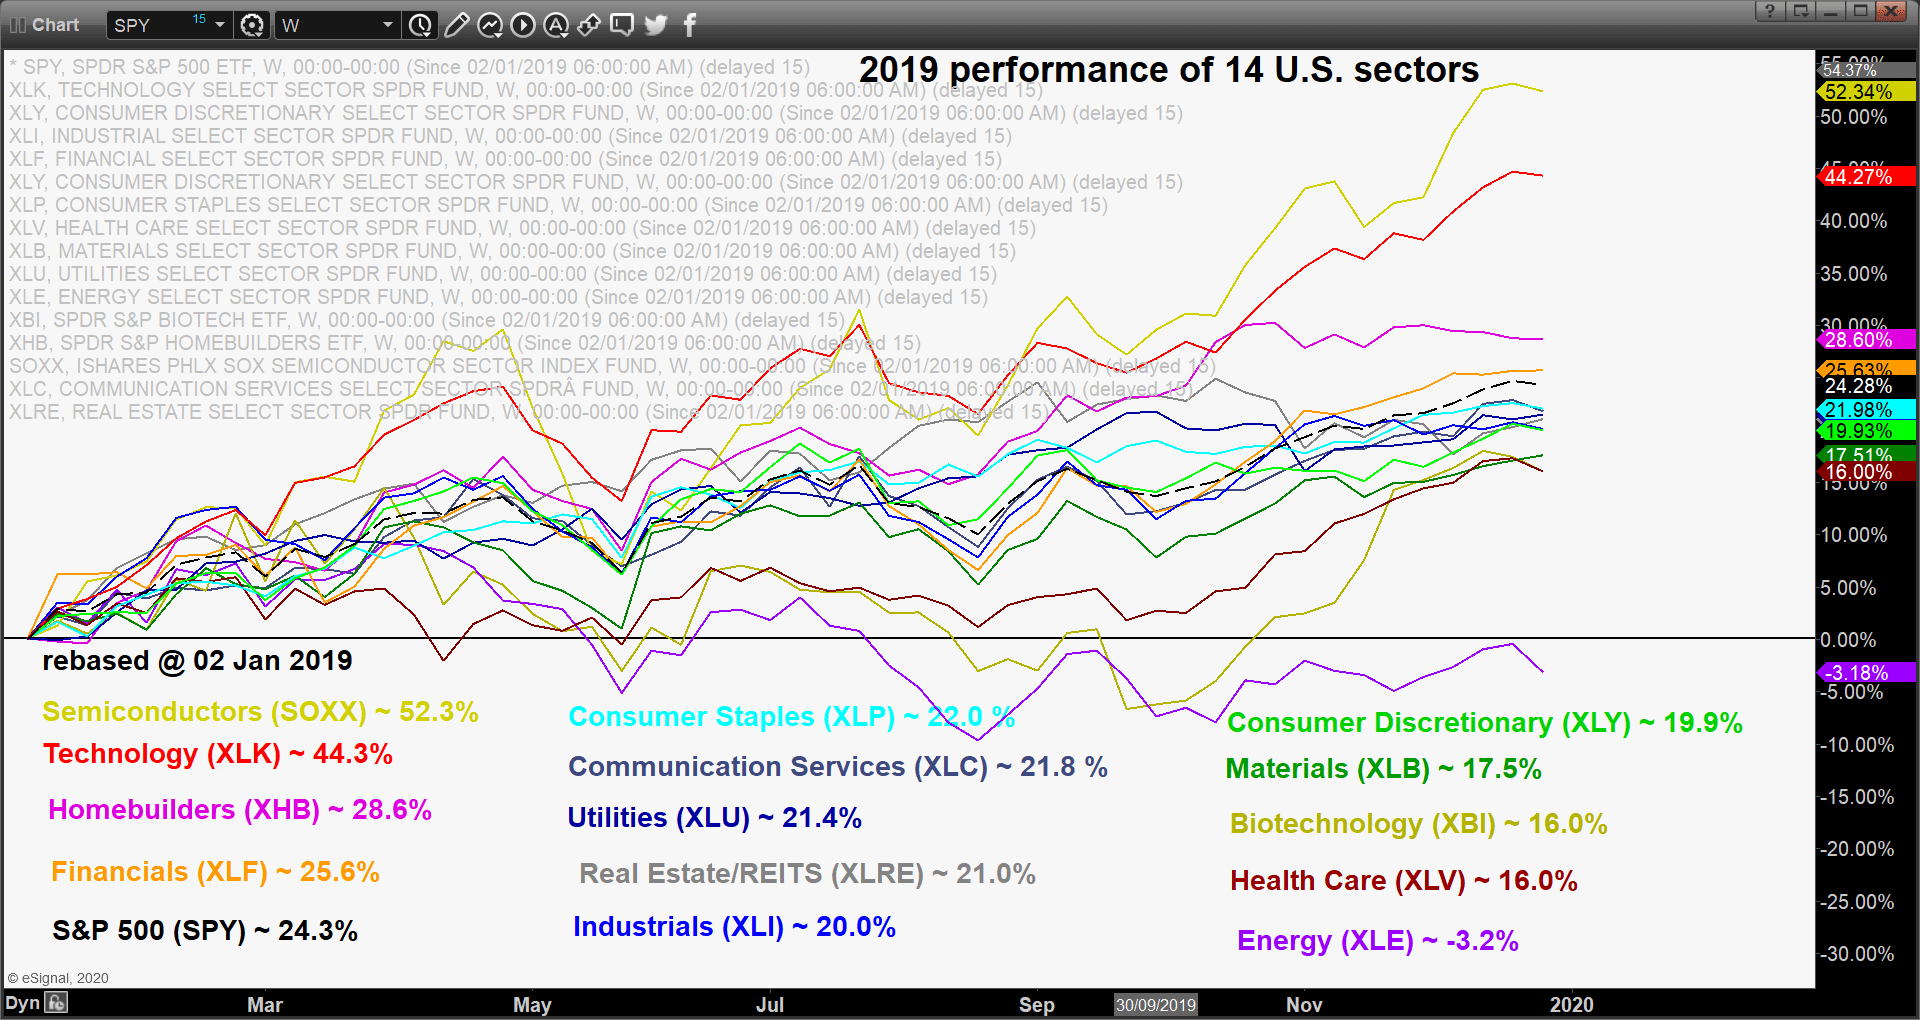
Thus, the price action of the SOXX (U.S. semiconductor sector that is a key beneficiary on a de-escalation of U.S-China trade tensions- see first chart) may continue to see a further rally to target the 265.10/55 resistance next week before a meaningful pull-back of 7% to 9% to take shape towards the key medium-term pivotal support of 237.85
as this piece of “good news” have already been “priced in” before the next potential impulsive upleg sequence materialises to target 276.25/279.20 resistance next.
On the other hand, daily close below 237.85 put the bulls on hold for deeper corrective pull-back towards the major support at 218.00 (former range resistance from 24 Apr/12 Sep 2019 & lower boundary of the ascending channel from 26 Dec 2018 low).
Key elements
- Since its 26 Dec 2018 low, the price action of SOXX has continued to evolve within an ascending channel with upper boundary now acting as a resistance at 279.20 which also confluences with a Fibonacci expansion cluster.
- The daily RSI oscillator remains positive above its corresponding support zone but it is coming close to an extreme overbought level of 75%. These observations suggest that medium-term upside momentum is at risk of reaching overstretched condition soon and may see an imminent pull-back in price action.
- Elliot Wave/fractal analysis suggest that the Index is coming to the potential end of its intermediate degree wave 3/ bullish upleg sequence in place since 05 Aug 2019 low with a likely end target at 265.10/55 (Fibonacci expansion cluster). Therefore, it may start to see a corrective down move wave 4/ sequence unfold next.
- The 237.85 key medium-term support its defined by the former swing high area of 15 Nov 2019, Fibonacci retracement cluster and the 55-day Moving Average that has saw significant price reactions on it in the past since 03 Dec 2018.
Charts are from eSignal
Medium-term technical on iShares PHLX Semiconductor (SOXX)
click to enlarge charts
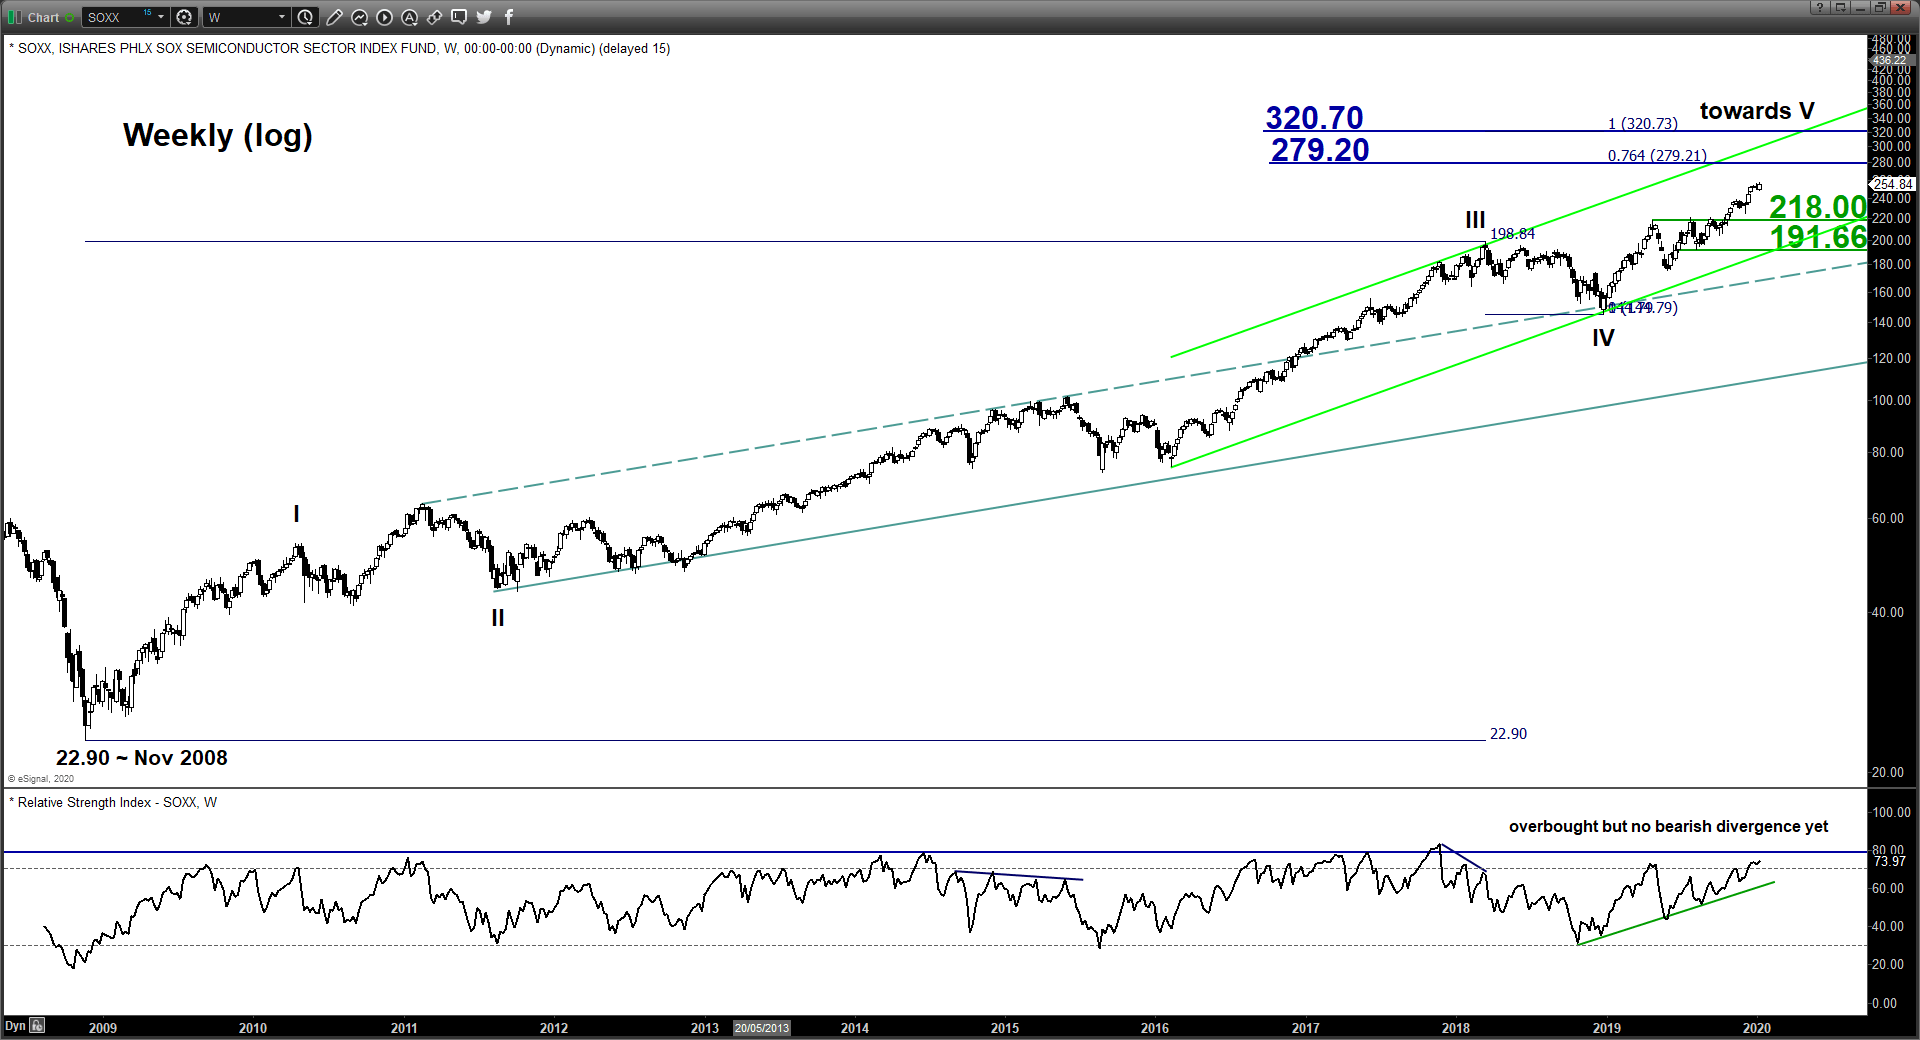
Key Levels (1 to 3 months)
Intermediate support: 247.10
Pivot (key support): 237.85
Resistances: 265.10/55 & 276.25/279.20
Next support: 218.00 (major)
Directional Bias (1 to 3 months)
Major uptrend of the SOXX in place since 26 Dec 2018 low of 144.79 remains intact. Right now, with U.S-Iran skirmish on the back burner, the focus with now turn towards U.S.-China diplomatic trade relations.
China has confirmed that Vice Premier Liu He, the top trade negotiator/special envoy will be heading to U.S. on 13 Jan to sign-off the official Phase One trade deal in the White House on 15 Jan. Risk assets such as stocks have staged a strong push up yesterday, 09 Jan with all the major U.S. benchmark stock indices (S&P 500, Nasdaq 100 & DJIA) hitting another fresh all-time highs. In fact, this piece of positive news flow is not a surprise as the Phase One trade deal agreement has already been made in the “limelight” since 12 Dec 2019 where the U.S. administration has agreed to the terms in principal with a suspension on a new wave of 15% U.S. tariffs on about US$160 billion of Chinese consumer goods that was scheduled to take effect on 15 Dec 2019. In return, China suspended additional tariffs on U.S. farm and automobiles products.
Thus, the price action of the SOXX (U.S. semiconductor sector that is a key beneficiary on a de-escalation of U.S-China trade tensions- see first chart) may continue to see a further rally to target the 265.10/55 resistance next week before a meaningful pull-back of 7% to 9% to take shape towards the key medium-term pivotal support of 237.85
as this piece of “good news” have already been “priced in” before the next potential impulsive upleg sequence materialises to target 276.25/279.20 resistance next.
On the other hand, daily close below 237.85 put the bulls on hold for deeper corrective pull-back towards the major support at 218.00 (former range resistance from 24 Apr/12 Sep 2019 & lower boundary of the ascending channel from 26 Dec 2018 low).
Key elements
- Since its 26 Dec 2018 low, the price action of SOXX has continued to evolve within an ascending channel with upper boundary now acting as a resistance at 279.20 which also confluences with a Fibonacci expansion cluster.
- The daily RSI oscillator remains positive above its corresponding support zone but it is coming close to an extreme overbought level of 75%. These observations suggest that medium-term upside momentum is at risk of reaching overstretched condition soon and may see an imminent pull-back in price action.
- Elliot Wave/fractal analysis suggest that the Index is coming to the potential end of its intermediate degree wave 3/ bullish upleg sequence in place since 05 Aug 2019 low with a likely end target at 265.10/55 (Fibonacci expansion cluster). Therefore, it may start to see a corrective down move wave 4/ sequence unfold next.
- The 237.85 key medium-term support its defined by the former swing high area of 15 Nov 2019, Fibonacci retracement cluster and the 55-day Moving Average that has saw significant price reactions on it in the past since 03 Dec 2018.
Charts are from eSignal
Related tags:
Latest market news




Open an account in minutes
Experience award-winning platforms with fast and secure execution, and enjoy tight spreads from 0.5 pts on FX and 0.3 pts on indices.
Economic calendar
Web Trader platform
Our sophisticated web-based platform is packed with features.
Related articles

S&P 500 forecast: Stocks extend drop as correction risks grow
US and global equity markets have extended Wednesday’s sell-off, with Wall Street opening lower after a weak handover from Asia and Europe. The deterioration in risk appetite has been spreading across global markets. The dollar was firmer, Treasury yields were holding onto yesterday’s gains, while gold, silver and bitcoin were all under pressure alongside equities and major currencies.


ASX 200 Rebound Stalls Despite Wall Street Surge
The ASX 200 rebound is struggling for traction despite a powerful Wall Street rally, leaving 8800 resistance and downside risks in focus.


Nikkei threatens breakout as tech rebound broadens
Breakouts across the SOX and Nasdaq are being matched by rebounds across Asia, with the Nikkei now threatening to join the move.

This report is intended for general circulation only. It should not be construed as a recommendation, or an offer (or solicitation of an offer) to buy or sell any financial products. The information provided does not take into account your specific investment objectives, financial situation or particular needs. Before you act on any recommendation that may be contained in this report, independent advice ought to be sought from a financial adviser regarding the suitability of the investment product, taking into account your specific investment objectives, financial situation or particular needs.
StoneX Financial Pte. Ltd., may distribute reports produced by its respective foreign entities or affiliates within the StoneX group of companies or third parties pursuant to an arrangement under Regulation 32C of the Financial Advisers Regulations. Where the report is distributed to a person in Singapore who is not an accredited investor, expert investor or an institutional investor (as defined in the Securities Futures Act), StoneX Financial Pte. Ltd. accepts legal responsibility to such persons for the contents of the report only to the extent required by law. Singapore recipients should contact StoneX Financial Pte. Ltd. at 6826 9988 for matters arising from, or in connection with the report.
In the case of all other recipients of this report, to the extent permitted by applicable laws and regulations neither StoneX Financial Pte. Ltd. nor its associated companies will be responsible or liable for any loss or damage incurred arising out of, or in connection with, any use of the information contained in this report and all such liability is hereby expressly disclaimed. No representation or warranty is made, express or implied, that the content of this report is complete or accurate.
StoneX Financial Pte. Ltd. is not under any obligation to update this report.
Trading CFDs carries a high level of risk that may not be suitable for some investors. Consider your investment objectives, level of experience, financial resources, risk appetite and other relevant circumstances carefully. The possibility exists that you could lose some or all of your investments, including your initial deposits. If in doubt, please seek independent expert advice. Visit www.forex.com/en-sg/terms-and-policies for the complete Risk Disclosure Statement.