



USD Breaks Down as USD/JPY Snaps Back: EUR/USD, GBP/USD
In last week’s video with the Dollar holding relatively strong near monthly highs I warned that President Trump could take a swing at the matter and that arrived on the weekend, followed by a decisive sell-off in the USD over the past week.
Share this:

US Dollar Drops with Aggression
With just a few hours to go until the close the US Dollar is down by more than 1.6% on the week, which would mark the largest weekly sell-off for the currency since May, just before the swing-low was set on the first day of Q3.
The week opened with fear around heightened tariffs after President Trump ramped up tensions over last weekend and I had warned that something of this nature could show in last Friday’s video. In the article last Friday, I had highlighted EUR/USD grinding at a big spot of support of 1.1592 but I still held preference for USD-weakness against the British Pound, which has broken out in a big way so far this week.
This is helped along by a larger pullback in USD/JPY, which is driving on the back of both fears of more rate hikes from the BoJ and the possibility of intervention at the 160.00 level as it seems the bank wants to set a line-in-the-sand for speculators. This doesn’t necessarily mean that reversal is near but given the change of pace it is something that needs to be monitored in early trade next week.
That said – we’re at the point now where we can see what USD bears are made of. It’s simple to be bearish at highs or near resistance, but what ultimately will make the trend is whether bears can push while near support or lows, as lower-lows are necessary for downside continuation. And that’s really been the missing piece for the past almost seven months now, after the sell-off in the Dollar stalled on the first day of Q3 and H2, 2025.
US Dollar Weekly Chart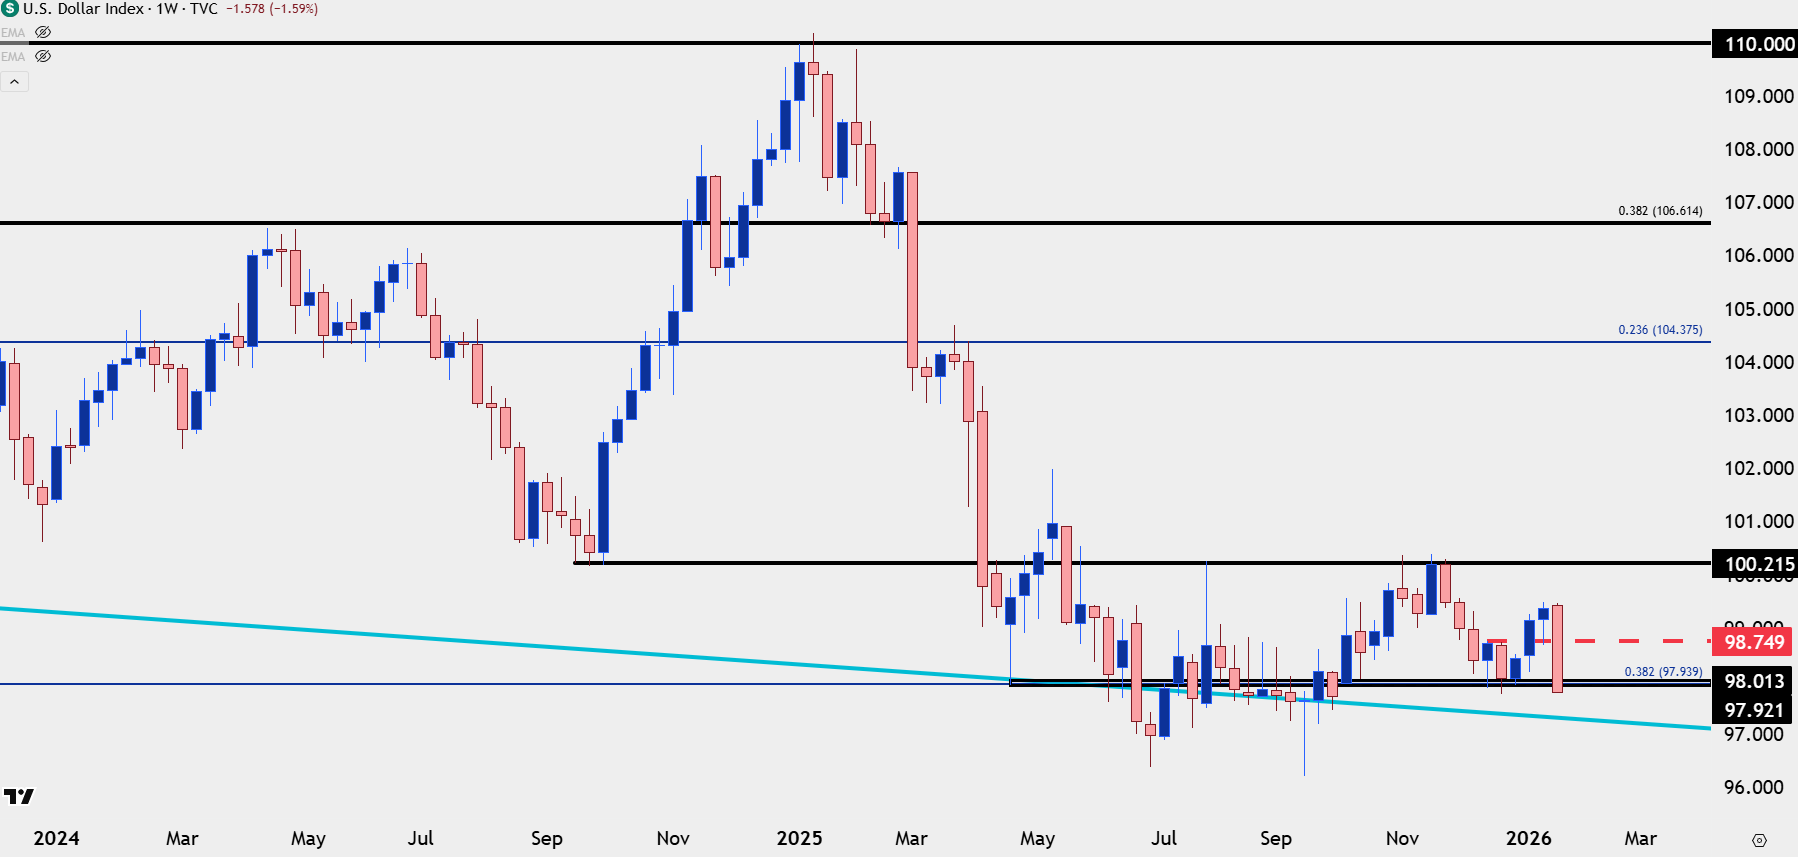
Chart prepared by James Stanley; data derived from Tradingview
EUR/USD
The mirror image of that six months of stall following a clean trend last year is EUR/USD, which is now testing a breakout from a symmetrical triangle and bull pennant formation. The 1.2000 level looms large here as buyers shied away from a test of that level last September, again, right when the Fed cut rates. But there’s also a lower-high from that at 1.1804 which is what I’m looking at as next resistance, and given shorter-term structure, there’s backdrop for trend continuation that I’ll look at a little lower.
EUR/USD Weekly Chart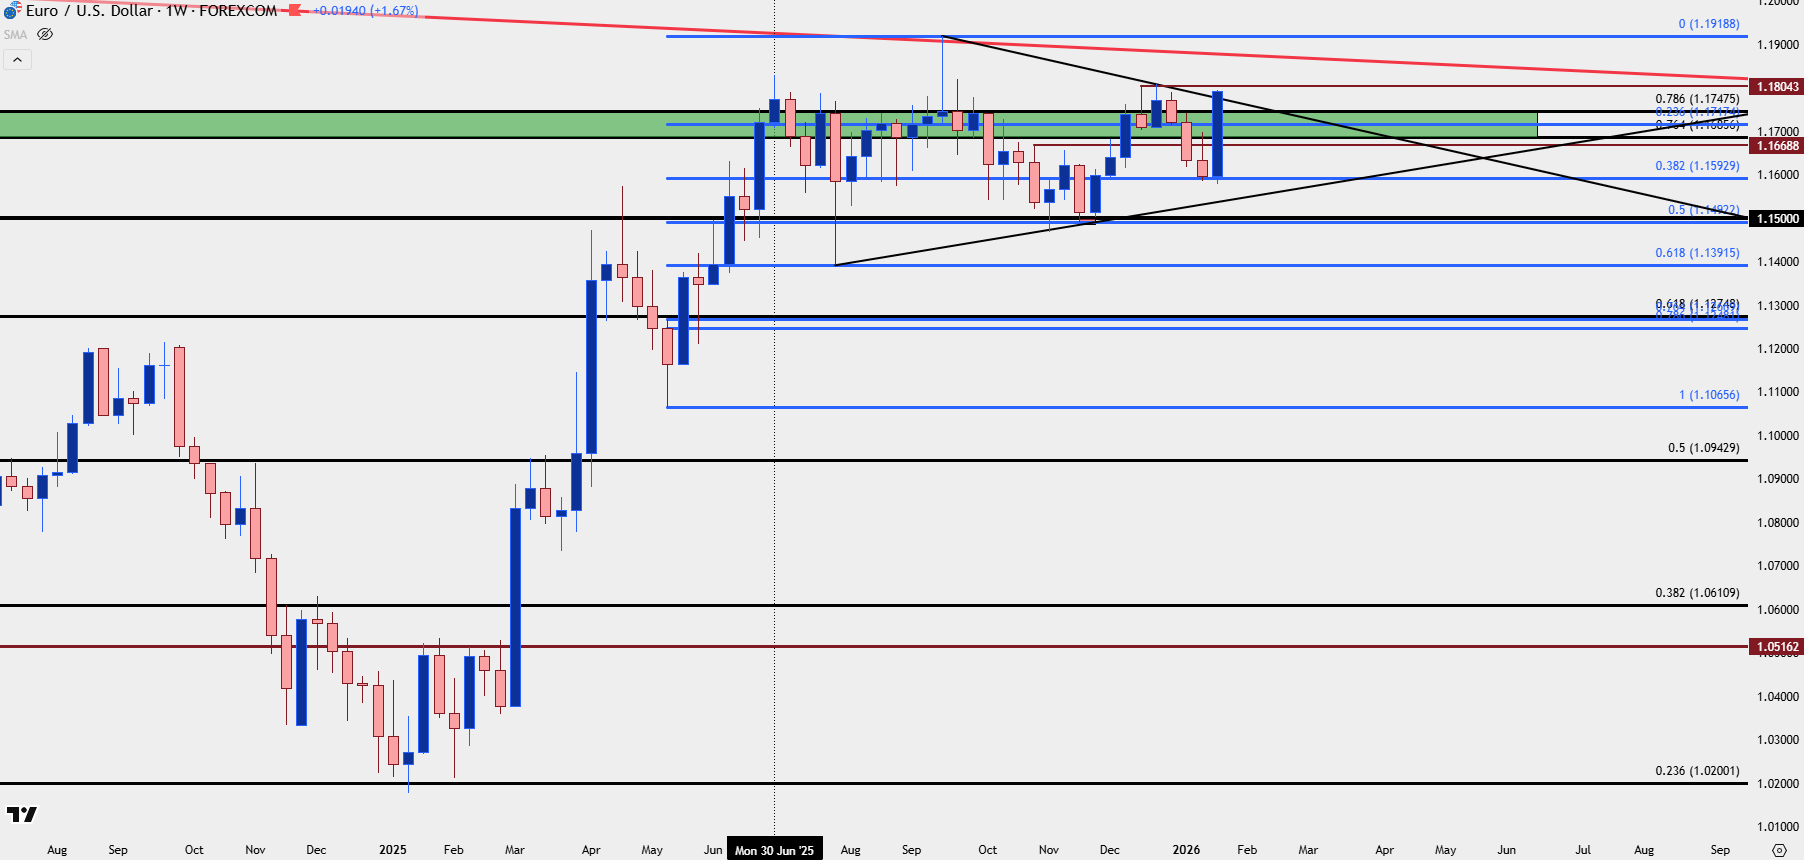
Chart prepared by James Stanley; data derived from Tradingview

EUR/USD Shorter-Term
As I said in the Tuesday webinar my preference for USD-weakness remains GBP/USD and as a comparison, Cable is already at a fresh high which speaks to that. But – if we are going to see a legitimate trend build in the US Dollar it’s the Euro that it will need some help from, as the single currency is a whopping 57.6% of the DXY basket.
If looking to work with the move, chasing this breakout test, particularly when so close to a prior lower-high, can be a challenge. Instead, there’s a few levels of note for pullbacks that can at least allow for more cogent risk management on continuation scenarios.
In last Friday’s article I looked at the 1.1592 level that was in-play at the time, and this was notable as it’s a Fibonacci level related to the 1.1492 price that helped to set the lows back in November. Now – the 23.6% retracement from that same study plots at 1.1717, and this is an area for higher-low support potential. There are also longer-term Fibonacci levels at 1.1748 and 1.1686, along with the swing-low from yesterday at 1.1669.
EUR/USD Four-Hour Chart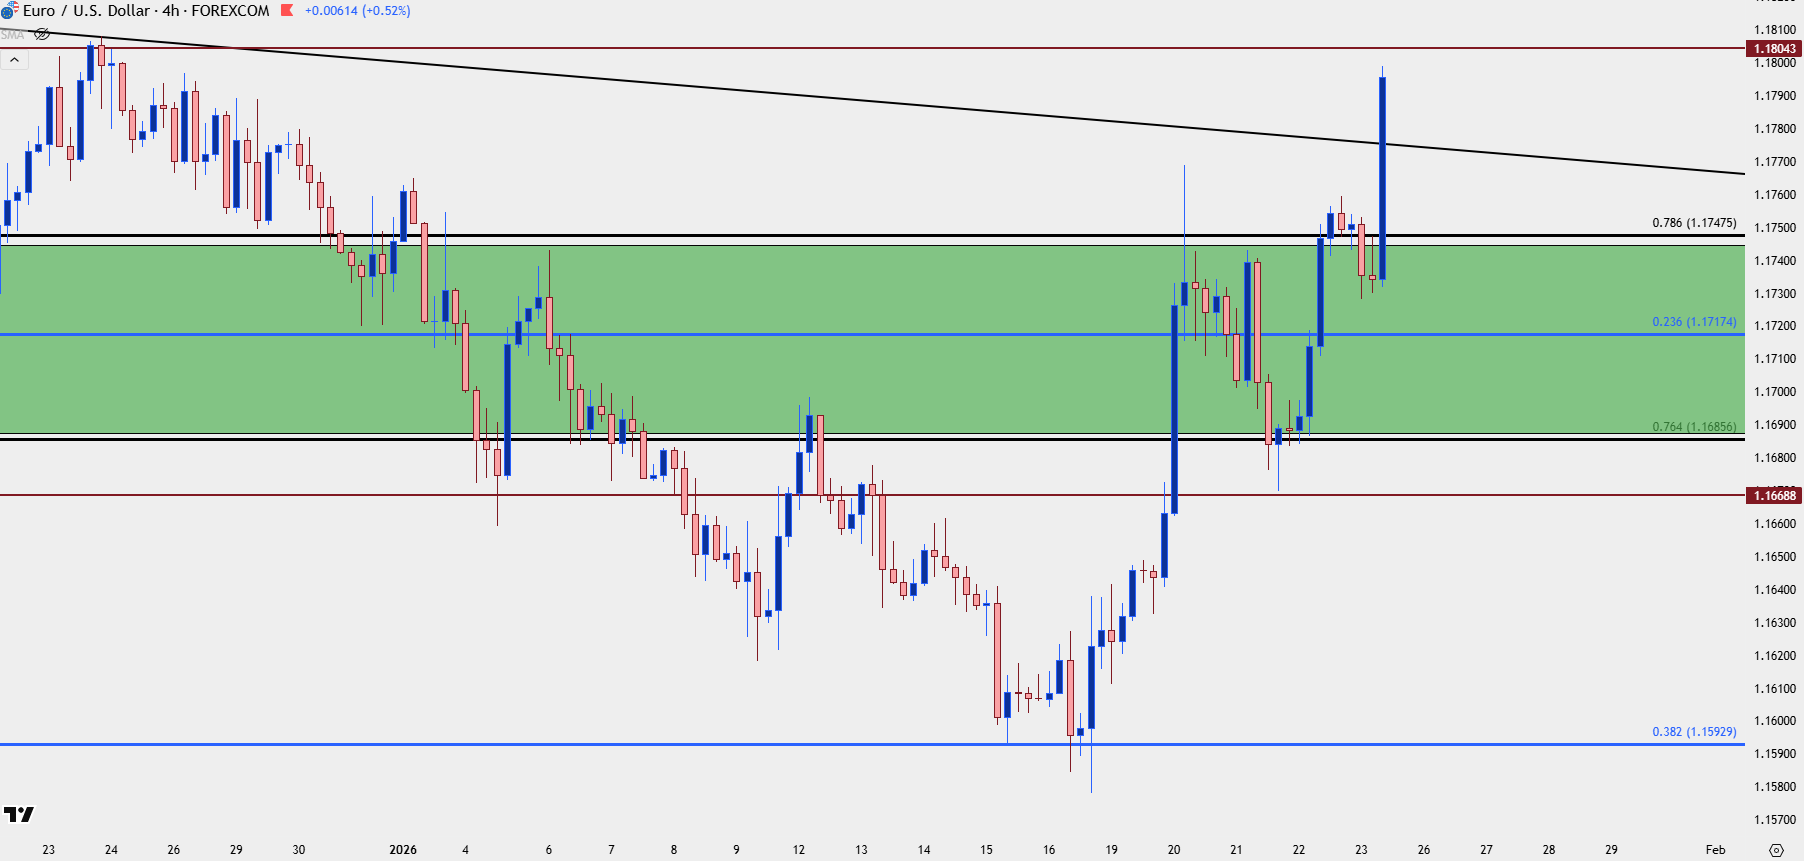
Chart prepared by James Stanley; data derived from Tradingview
GBP/USD
I still prefer GBP/USD for USD-weakness scenarios and the way the pair has traded over the past couple of weeks keeps that alive. When USD-strength was running into the end of last week, GBP/USD was building a falling wedge formation. That began to breakout earlier this week, helped along by the initial dash of USD-weakness.
I looked at an updated setup in the webinar on Tuesday, getting more detailed with the four-hour chart to show how the trend could be worked with after the initial breakout, and the 1.3414 Fibonacci level came in cleanly as support that allowed for a burst up to another higher-high.
At this point, the challenge is chasing a fresh breakout, and there’s now support potential at the 1.3500 psychological level and the 1.3460 swing that was in-play ahead of the current breakout.
But ideally, bulls wouldn’t allow for a pullback all the way to 1.3500, so more attractive for bullish continuation (and also USD-weakness continuation) would be a hold of higher-low support around the prior swing high of 1.3567.
GBP/USD Four-Hour Chart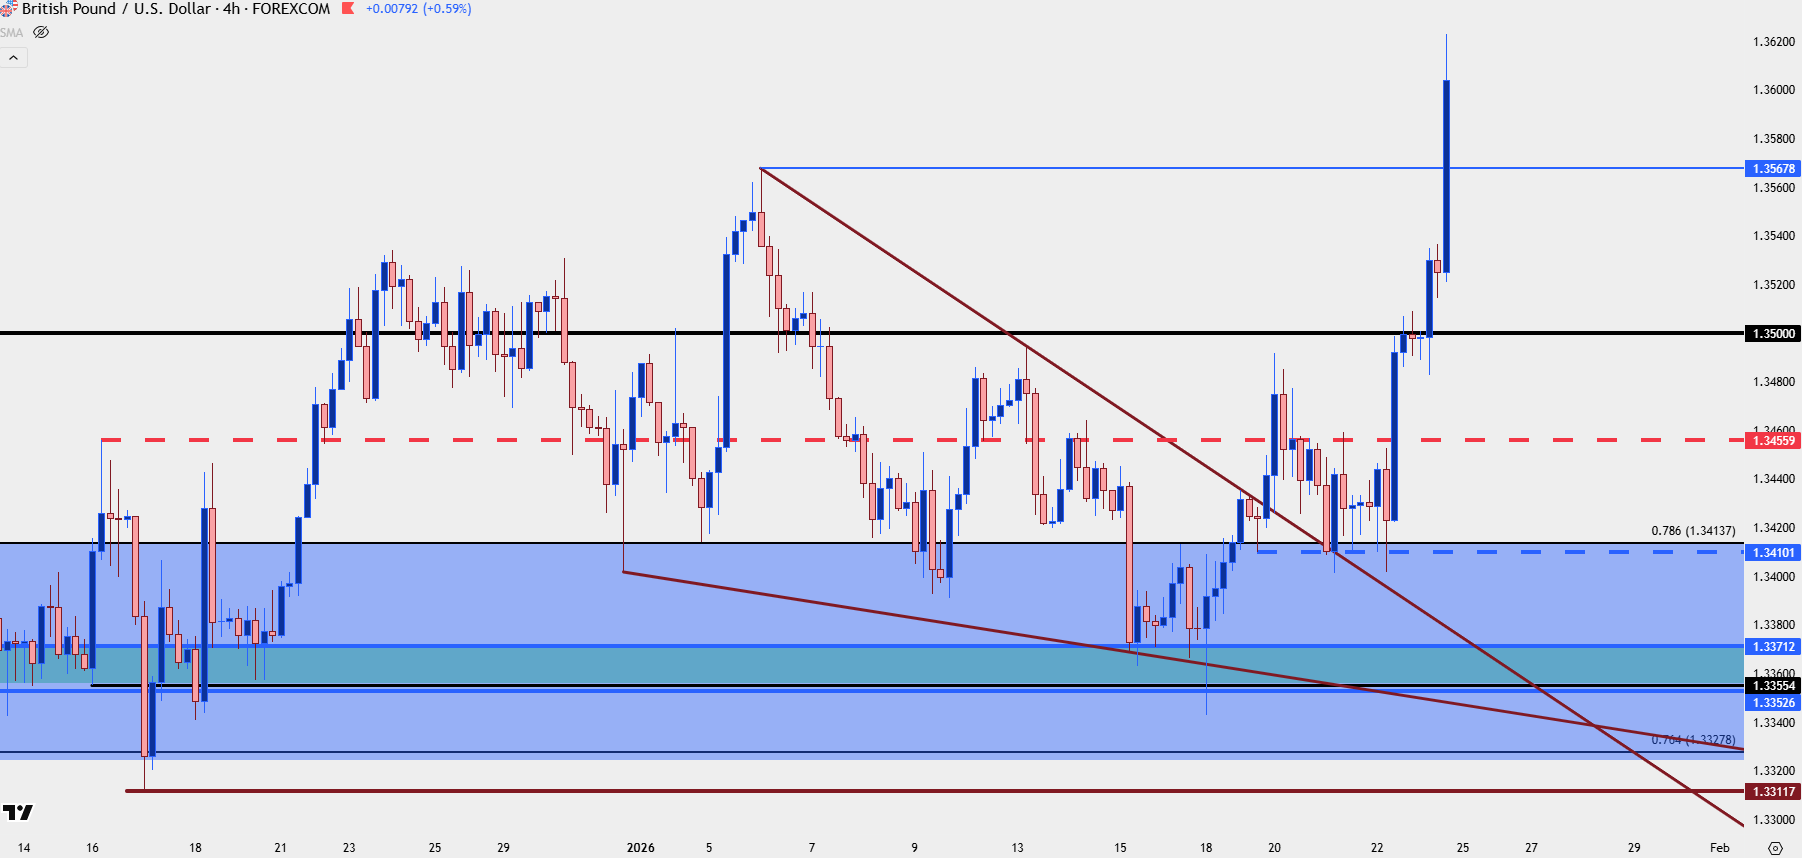
Chart prepared by James Stanley; data derived from Tradingview
USD/JPY
This is the current source of worry for USD-bulls and it’s something we’re not going to have answer for until some time next week, at the earliest. The Bank of Japan threatened to hike rates and with a persistent push from President Trump for rate cuts, that further narrows the expectation for divergence in rate policy between the two economies.
This isn’t exactly a new story, however, but probably more important than just the fundamental push is the positioning behind the move. Back in 2021 as US inflation began to climb, traders started to load on the long side of USD/JPY. And then as the Fed hiked rates in 2022, prices in the pair hockey-sticked as there was now a handsome carry trade on the long side of USD/JPY. Bears were punished for holding shorts while bulls were rewarded, so there wasn’t much to stop the rally until the Bank of Japan intervened after the 150.00 handle in 2022.
The prior swing high of 151.95 held the highs again in 2023, but when the price came back into play in early-2024, a breakout hit as stops were broken in big way as the pair ultimately pushed up to the 160.00 handle.
The BoJ intervened on that first re-test of 160.00 but it didn’t really work, as the same 151.95 level set the lows a week later and prices just went right back above the 160.00 handle. But the next intervention in July certainly did work to get USD/JPY back down, and it perhaps worked a little too well as that positioning component quickly became problematic.
The axiom most common for such scenarios is the crowded movie theater example, when the smell of smoke and a narrow exit door compels attendees to rush for the exits as the thought of being left behind carries catastrophic consequences. That’s what we saw in the summer of 2024 as that heavily one-sided carry trade all rushed for the exits at the same time, and there was significant collateral damage as US equities took a massive turn for the worse.

What ultimately calmed matters was the BoJ assuring that they had no further plans to hike rates at the time, and then the US Dollar reversed in Q4 and before you know it, many were proclaiming that the ‘carry trade was back.’
Fast forward a year and a half later and it’s still the 160.00 level that brings drama in USD/JPY, and it seems this is a level that the Finance Ministry will want to defend. With the pair getting closer and closer to that price, the perceived risk-reward gets less and less attractive for longs, and that can compel closing of positions. So, it might not quite be the smell of smoke in the movie theater, but there’s the fear that a whiff may soon be arriving.
It's far from game over here, and again, it’s probably not until next week that we’ll have some idea of whether there’s a larger point of worry to contend with. But, as I’ve been saying, chasing breakouts in USD/JPY feels unwise given that history and pullback to support, at least at this point, still retain bullish potential.
If we do see a larger unwind episode, it’s something that can carry impact through the Dollar in other major pairs, as the sell-off in USD/JPY in Q3 of 2024 is a factor that helped to drive EUR/USD strength.
USD/JPY Weekly Price Chart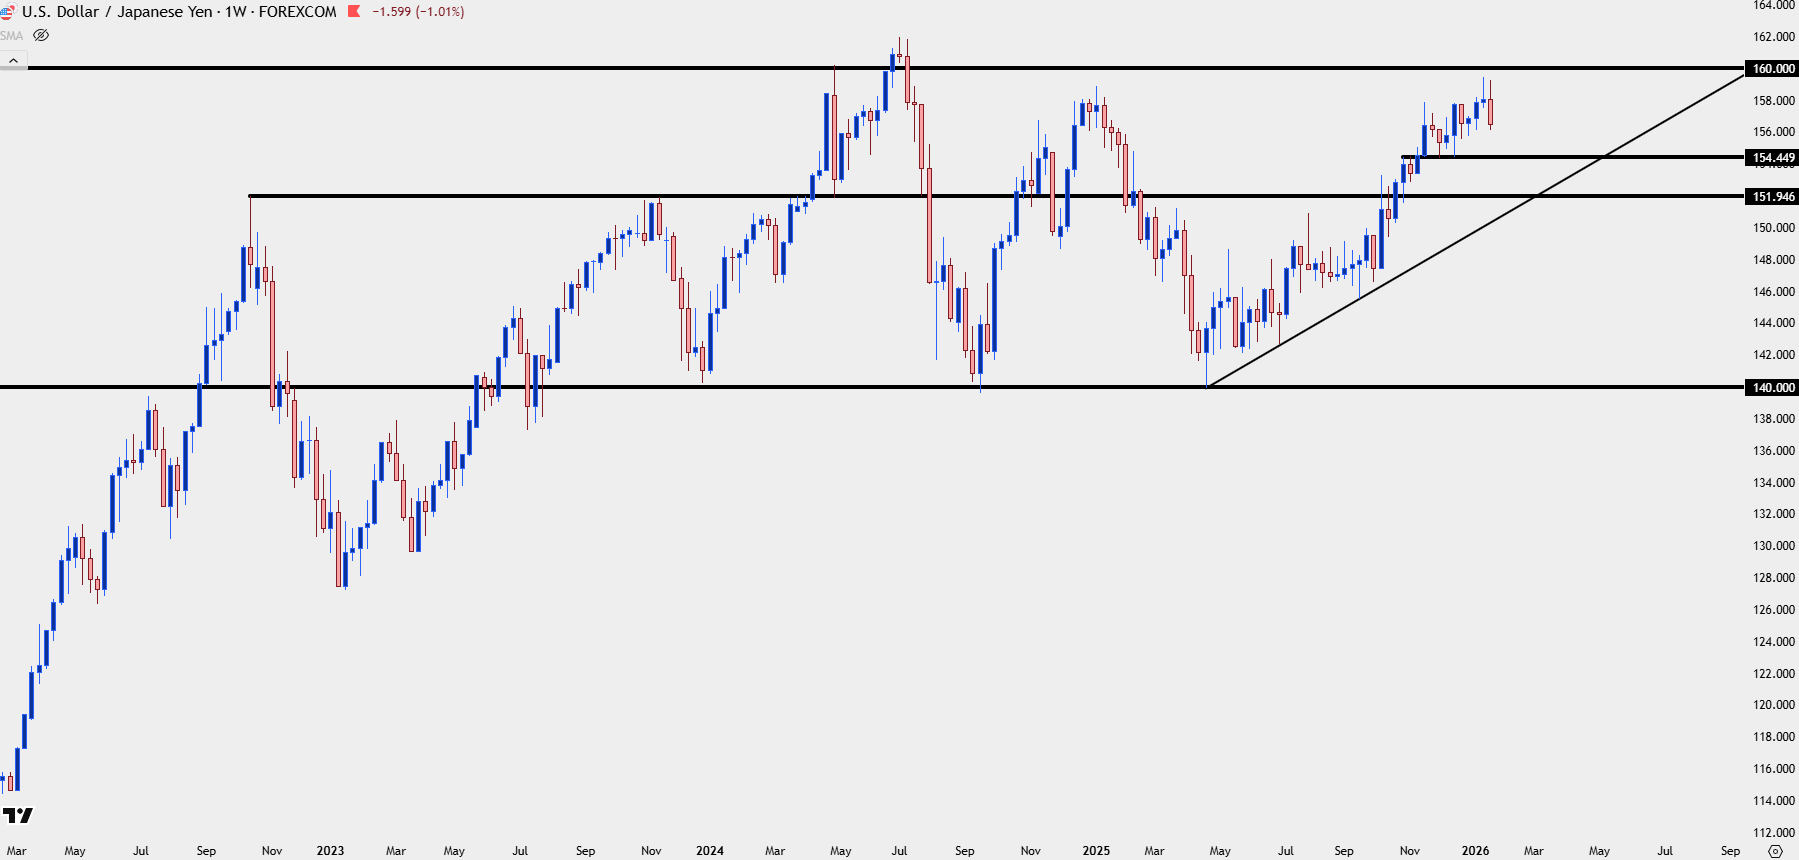
Chart prepared by James Stanley; data derived from Tradingview
--- written by James Stanley, Senior Market Analyst, Global Macro


Open an account in minutes
Experience award-winning platforms with fast and secure execution, and enjoy tight spreads from 0.5 pts on FX and 0.3 pts on indices.
Economic calendar
Web Trader platform
Our sophisticated web-based platform is packed with features.
Related articles

USD/JPY outlook: Hawkish Fed recalibration pressures the yen
Stronger US growth momentum and rising Treasury yields are keeping USD/JPY pointed higher, even as Japanese policymakers try to limit the pressure building across domestic markets.


USD/MXN Forecast: Peso Loses Momentum Ahead of Banxico Decision
Over recent trading sessions, the Mexican peso has started to show signs of losing strength against the U.S. dollar. This can be seen in the performance of USD/MXN, which has gained more than 1.7% over the last three sessions, highlighting the dollar's renewed strength against the peso.


USD/JPY Bulls Continue to Push as Markets ‘Bet Against the House’
USD/JPY is now up by more than 500 pips from the low taken the day that Scott Bessent taunted markets, saying ‘you can bet against me if you want.’
This report is intended for general circulation only. It should not be construed as a recommendation, or an offer (or solicitation of an offer) to buy or sell any financial products. The information provided does not take into account your specific investment objectives, financial situation or particular needs. Before you act on any recommendation that may be contained in this report, independent advice ought to be sought from a financial adviser regarding the suitability of the investment product, taking into account your specific investment objectives, financial situation or particular needs.
StoneX Financial Pte. Ltd., may distribute reports produced by its respective foreign entities or affiliates within the StoneX group of companies or third parties pursuant to an arrangement under Regulation 32C of the Financial Advisers Regulations. Where the report is distributed to a person in Singapore who is not an accredited investor, expert investor or an institutional investor (as defined in the Securities Futures Act), StoneX Financial Pte. Ltd. accepts legal responsibility to such persons for the contents of the report only to the extent required by law. Singapore recipients should contact StoneX Financial Pte. Ltd. at 6826 9988 for matters arising from, or in connection with the report.
In the case of all other recipients of this report, to the extent permitted by applicable laws and regulations neither StoneX Financial Pte. Ltd. nor its associated companies will be responsible or liable for any loss or damage incurred arising out of, or in connection with, any use of the information contained in this report and all such liability is hereby expressly disclaimed. No representation or warranty is made, express or implied, that the content of this report is complete or accurate.
StoneX Financial Pte. Ltd. is not under any obligation to update this report.
Trading CFDs carries a high level of risk that may not be suitable for some investors. Consider your investment objectives, level of experience, financial resources, risk appetite and other relevant circumstances carefully. The possibility exists that you could lose some or all of your investments, including your initial deposits. If in doubt, please seek independent expert advice. Visit www.forex.com/en-sg/terms-and-policies for the complete Risk Disclosure Statement.