











USD/CAD Forecast: Tariff Jitters Clash with Weaker U.S. Data and Bond Bulls
USD/CAD has been grinding higher on trade war concerns, but with U.S. economic data rolling over and bond yields plunging, the rally faces mounting risks. With a key resistance zone in sight, is a short opportunity emerging?
Share this:

- USD/CAD lifted by Trump’s tariff push but faces resistance overhead
- U.S. data missing forecasts at the fastest pace in five months
- Fed rate cut bets grow, pushing Treasury yields to 2025 lows
- Bond futures signal lower yields, reinforcing bearish USD/CAD risks
- Key levels: Watching 50DMA for potential short setups
Summary
The Canadian dollar has been on the back foot against its U.S. counterpart since President Donald Trump reaffirmed earlier this week that proposed 25% tariffs on Canadian imports remain on track for early March implementation. However, how much further USD/CAD can push higher is questionable given its strong long-term correlation with U.S. 10-year Treasury yields.
The broader environment isn’t exactly supportive of the U.S. dollar right now. U.S. economic data is rolling over, the government is in austerity mode, Treasury supply remains purposely restricted, and Scott Bessent has made it clear that lowering benchmark rates is a key priority for the Trump administration to ease borrowing costs for households and businesses. Add in an unfavourable technical backdrop for bond bears and USD/CAD’s proximity to a well-defined resistance zone, and a potential short setup is emerging.
Economic Divergence Evident
U.S. economic data is now undershooting market expectations at the fastest pace in more than five months, as reflected in Citigroup’s economic surprise index below. A reading below zero—seen in the blue shading—indicates more data is missing to the downside than exceeding forecasts. While this doesn’t suggest economic activity is collapsing, just underperforming relative to expectations, it stands in stark contrast to Canada, where data is surprising to the upside at the strongest rate since July last year.
Source: Refinitiv
Tariffs or not, that’s hardly a macro signal that screams buy USD/CAD, especially with Canada pledging to retaliate if the U.S. moves ahead with the measures.
U.S. Bond Bulls Running Hard
Fixed income markets are attuned to weaker U.S. data. Futures now reflect expectations for more than two full 25bp rate cuts from the Fed in 2025—the most since mid-December—while the U.S. 2s10s curve is now the flattest in nearly three months. That suggests growth and inflation expectations are being pulled back at a rapid pace.
Source: TradingView
U.S. 10-year Treasury yields have also fallen to their lowest level of 2025. That’s significant for USD/CAD given the pair has maintained a 0.92 correlation coefficient with benchmark yields over the past six months.
Downside Risks for Yields, USD/CAD?
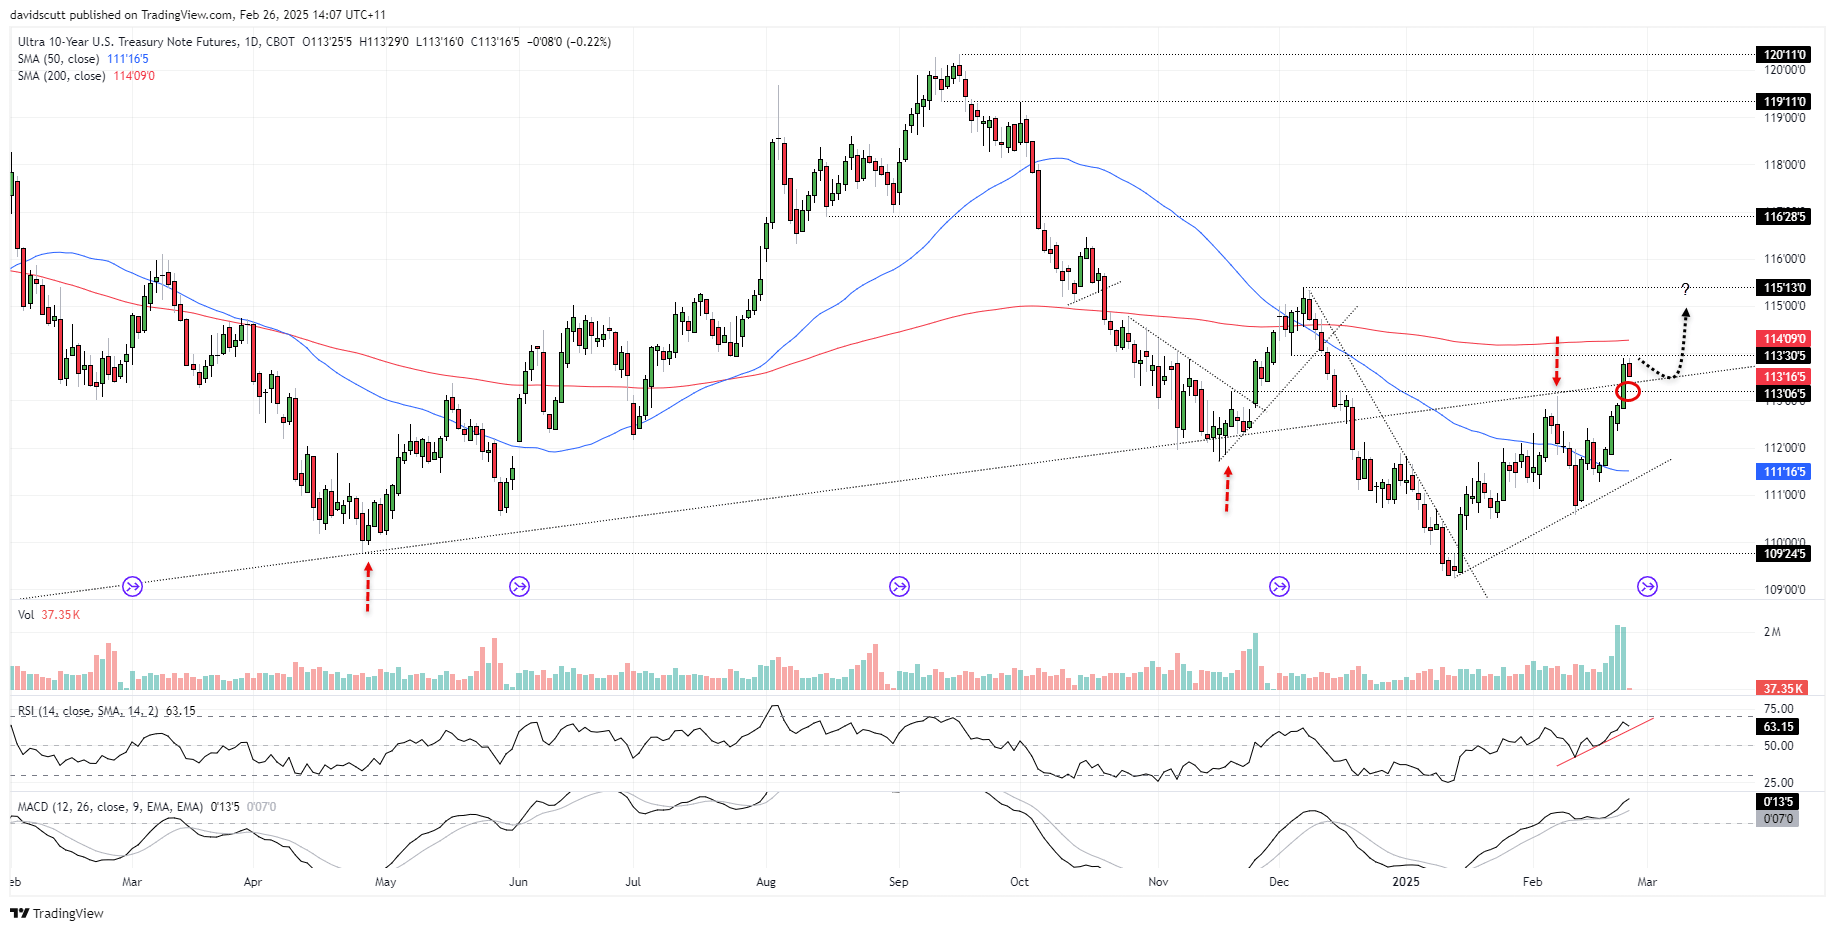
From a technical perspective, U.S. 10-year Treasury note futures—used to gauge directional risks for yields due to their inverse relationship with bond prices—suggest downside risks to both may be increasing.
Source: TradingView
Benchmark bond futures have surged into the contract roll on heavy volume, reclaiming a key uptrend that previously acted as strong buying support before breaking down in late December.
While some may argue that the price is forming a rising wedge—suggesting fresh shorts are positioning for a resumption of the bearish trend—I’m unconvinced after this week’s bullish price action. RSI (14) and MACD are flashing bullish momentum signals, and with fundamentals favouring bond bulls, the path of least resistance appears to be higher. That means lower yields.
USD/CAD: Bearish Bias Favoured
While falling yields would typically support USD/CAD outside of extreme risk-off periods, there’s no rush to short just yet. However, if the pair pushes a little higher, it will approach its 50-day moving average—a level it struggled to break earlier this month.
Source: TradingView
A short trade could be established at the 50-day moving average, with a stop above 1.4372 for protection. The first downside target would be 1.4270, followed by 1.4150. A break of the latter could open the door to further declines towards 1.4100 or even 1.3932.
RSI (14) has turned higher, and MACD has crossed over from below, signalling momentum is shifting bullish. Again, that reinforces the need for patience before entering short positions.
Elevated Event Risk
Beyond tariff headlines—which are arguably close to being priced in given Trump has already followed through on a similar threat with China—there are significant event risks over the next three sessions that could trigger meaningful market volatility.
Source: TradingView
Nvidia’s earnings report after Wednesday’s close is a key one, given the hype surrounding AI stocks. A miss would likely drive risk aversion, supporting the U.S. dollar. U.S. GDP could also fuel economic concerns if it undershoots expectations, while Friday’s PCE report will be closely watched—not just for the Fed’s preferred inflation measure but also for consumer income and spending data. Weakness there would typically support short USD/CAD positions.
-- Written by David Scutt
Follow David on Twitter @scutty
How to trade with City Index
You can trade with City Index by following these four easy steps:
- Open an account, or log in if you’re already a customer
• Open an account in the UK
• Open an account in Australia
• Open an account in Singapore
- Search for the market you want to trade in our award-winning platform
- Choose your position and size, and your stop and limit levels
- Place the trade
Related tags:


Open an account in minutes
Experience award-winning platforms with fast and secure execution, and enjoy tight spreads from 0.5 pts on FX and 0.3 pts on indices.
Economic calendar
Web Trader platform
Our sophisticated web-based platform is packed with features.
Related articles
Gold Q4 2026 outlook: Resilience in the face of rallying dollar and yields
As we headed towards the latter stages of Q3 and into Q4, the Fed had just hiked rates in a hawkish FOMC meeting, while the likes of the ECB and BoJ had also tightened their respective policies. Oil prices remained elevated amid the prolonged US-Iran conflict. Meanwhile, bond yields were breaking out, and the dollar was higher across the board. Yet, remarkably, gold was still holding in the positive territory for the third quarter, even if it had weakened somewhat in September.


EUR/USD Q4 2026 Outlook: Euro at a Crossroads as Fed, ECB Tighten 9 25 2026
EUR/USD enters Q4 at a pivotal inflection point as competing Fed-ECB policy paths and persistent inflation risks collide with major technical support.


AUD/USD Q4 Outlook: RBA and Fed Hikes Set the Tone
AUD/USD enters Q4 with RBA and Fed hikes in focus as sticky inflation, rising unemployment and US dollar strength shape the Australian dollar.

This report is intended for general circulation only. It should not be construed as a recommendation, or an offer (or solicitation of an offer) to buy or sell any financial products. The information provided does not take into account your specific investment objectives, financial situation or particular needs. Before you act on any recommendation that may be contained in this report, independent advice ought to be sought from a financial adviser regarding the suitability of the investment product, taking into account your specific investment objectives, financial situation or particular needs.
StoneX Financial Pte. Ltd., may distribute reports produced by its respective foreign entities or affiliates within the StoneX group of companies or third parties pursuant to an arrangement under Regulation 32C of the Financial Advisers Regulations. Where the report is distributed to a person in Singapore who is not an accredited investor, expert investor or an institutional investor (as defined in the Securities Futures Act), StoneX Financial Pte. Ltd. accepts legal responsibility to such persons for the contents of the report only to the extent required by law. Singapore recipients should contact StoneX Financial Pte. Ltd. at 6826 9988 for matters arising from, or in connection with the report.
In the case of all other recipients of this report, to the extent permitted by applicable laws and regulations neither StoneX Financial Pte. Ltd. nor its associated companies will be responsible or liable for any loss or damage incurred arising out of, or in connection with, any use of the information contained in this report and all such liability is hereby expressly disclaimed. No representation or warranty is made, express or implied, that the content of this report is complete or accurate.
StoneX Financial Pte. Ltd. is not under any obligation to update this report.
Trading CFDs carries a high level of risk that may not be suitable for some investors. Consider your investment objectives, level of experience, financial resources, risk appetite and other relevant circumstances carefully. The possibility exists that you could lose some or all of your investments, including your initial deposits. If in doubt, please seek independent expert advice. Visit www.forex.com/en-sg/terms-and-policies for the complete Risk Disclosure Statement.