











USD/CHF Forecast: Rate Differentials Dominate as Fed, SNB Decisions Loom
The Swiss franc is flexing its muscles again as yield spreads narrow, keeping USD/CHF under pressure. With the Fed and SNB decisions ahead, is another bearish leg just around the corner?
Share this:

- USD/CHF remains heavy as rate differentials drive market action
- Watch for potential downside break from bear flag pattern
- Fed and SNB rate decisions are the key risk events for traders next week
Summary
Interest rate differentials between the United States and Switzerland have reasserted control over USD/CHF movements, making next week’s U.S. Federal Reserve and Swiss National Bank (SNB) policy decisions a blockbuster two-day market event. Sitting in what resembles a bear flag pattern, traders should be alert to the risk of a resumption of the broader bearish trend.
Rate Differentials Reassert Control
Interest rate differentials are once again dominating USD/CHF movements, with its rolling daily correlation over the past month with U.S.-Switzerland two- and 10-year yield spreads sitting at 0.93 and 0.89 respectively.
Source: TradingView
Digging into those extremely strong relationships, they largely reflects shifts in U.S. rates markets, especially at the front-end of the curve which is most impacted by central bank expectations. However, the recent lift in Swiss yields—spurred by plans for increased fiscal spending across the E.U. and a potential end to the war in Ukraine—has also been a factor, helping to narrow yield differentials and pressure USD/CHF lower.
The franc has also not lost its safe-haven appeal, maintaining a strong inverse relationship with expected 30-day volatility in U.S. equities and Treasuries over the same timeframe.
It’s little wonder why USD/CHF is looking heavy on the charts and at risk of resuming the bearish trend established earlier this year.
Fed, SNB Rate Decisions Loom Large
Aside from volatility created by U.S. trade policy—which resembles the random function on my school calculator given the speed at which it turns—the message from the correlation coefficient analysis is clear: next week’s Federal Reserve and SNB interest rate decisions are major events for USD/CHF traders.
Source: Bloomberg
Traders attach almost zero chance of the Fed funds rate changing next Wednesday, putting the probability at just 2.7%. Nada. That means the Fed statement, revised dot plot tracking individual member expectations for the funds rate, and Jerome Powell’s press conference will guide direction. Three cuts are currently favoured by the end of 2025, up from just one a month ago. Three months ago, the median FOMC forecast had two cuts pencilled in for this year. If the Fed delivers an assessment similar to market pricing, it may spark another leg lower in U.S. Treasuries, likely putting downside pressure on USD/CHF if that eventuates.
Source: Bloomberg
Whereas a Fed rate move is highly unlikely, markets favour another 25bp rate cut from the SNB, taking the overnight rate to 0.25%. At just over 20%, the probability of rates being left unchanged is low. However, the SNB has delivered multiple dovish surprises already this cycle, cutting more aggressively than markets expected early on. Given that track record, and with European growth expectations improving despite tariff uncertainty, don’t be shocked if the SNB delivers another surprise by standing pat. If it does, expect a kneejerk move lower in USD/CHF.
Source: TradingView
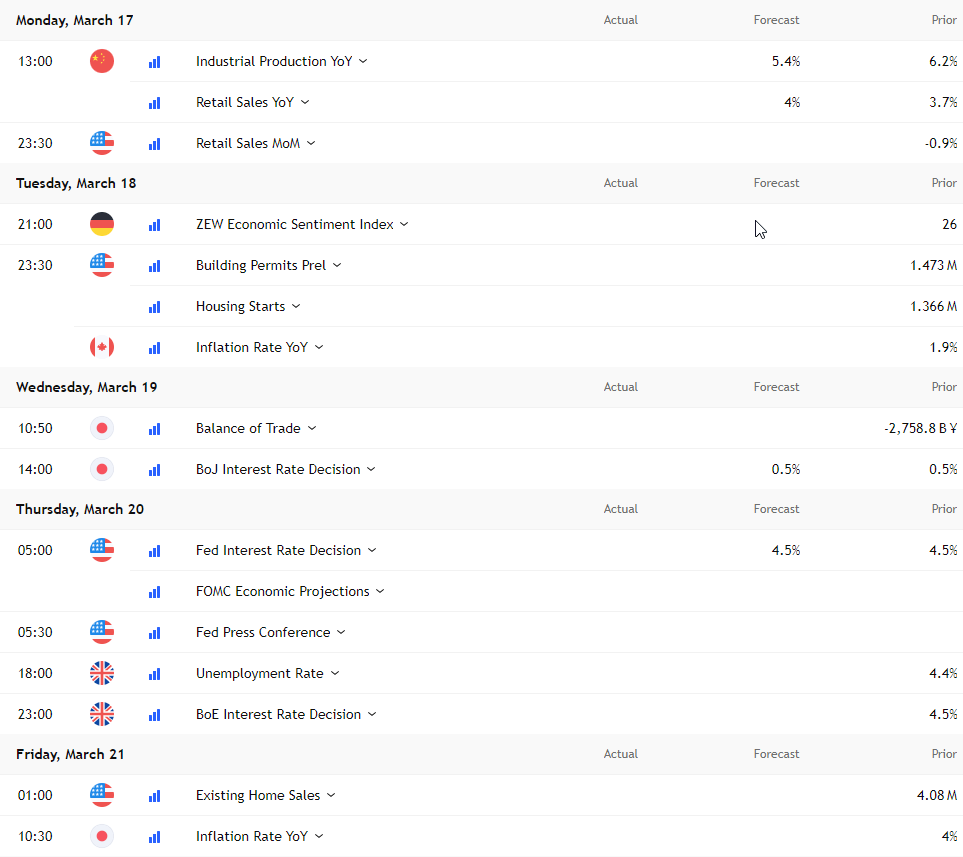
Before the Fed and SNB rate decisions, the only other known risk events likely to influence USD/CHF are Monday’s U.S. retail sales report and Wednesday’s BoJ policy decision. The latter could see the bank firm up expectations for another rate hike following early evidence from spring wage negotiations in Japan.
USD/CHF Bear Trend Pauses
The strong bearish trend for USD/CHF stalled this week, with buying support emerging beneath .8774, continuing the pattern seen in December. The net result has been a grind higher before running into resistance at .8854, forming what resembles a bear flag on the charts. That should put traders on alert for a potential downside break and resumption of the bearish trend.
Indicators like RSI (14) and MACD are providing mixed signals on price momentum, with the former trending higher while the latter remains below the signal line. However, the modest RSI (14) uptrend looks vulnerable, mirroring the unconvincing price action.
Source: TradingView
If the price breaks down from the bear flag, immediate levels of note include .8774, .8711, and .8617, the latter being a more substantial support level. On the topside, a break of .8854 would put .8920 and .8966 on the radar for bulls.
The price is hanging around the 200-day moving average like a bad smell this week, but having traded through it on multiple occasions like it didn’t exist, it shouldn’t be a major consideration for traders.
-- Written by David Scutt
Follow David on Twitter @scutty
How to trade with City Index
You can trade with City Index by following these four easy steps:
- Open an account, or log in if you’re already a customer
• Open an account in the UK
• Open an account in Australia
• Open an account in Singapore
- Search for the market you want to trade in our award-winning platform
- Choose your position and size, and your stop and limit levels
- Place the trade
Related tags:
Latest market news



Open an account in minutes
Experience award-winning platforms with fast and secure execution, and enjoy tight spreads from 0.5 pts on FX and 0.3 pts on indices.
Economic calendar
Web Trader platform
Our sophisticated web-based platform is packed with features.
Related articles
EUR/USD weekly outlook: Oil, inflation and NFP in focus
After coming under significant pressure in recent weeks, the EUR/USD came off its lows to finish the week on a positive note on Friday, albeit with only a mild rebound. That was not enough to prevent the exchange rate falling for the third consecutive week, as the US dollar and bond yields rallied across the board.

Gold Q4 2026 outlook: Resilience in the face of rallying dollar and yields
As we headed towards the latter stages of Q3 and into Q4, the Fed had just hiked rates in a hawkish FOMC meeting, while the likes of the ECB and BoJ had also tightened their respective policies. Oil prices remained elevated amid the prolonged US-Iran conflict. Meanwhile, bond yields were breaking out, and the dollar was higher across the board. Yet, remarkably, gold was still holding in the positive territory for the third quarter, even if it had weakened somewhat in September.

EUR/USD Q4 2026 Outlook: Euro at a Crossroads as Fed, ECB Tighten 9 25 2026
EUR/USD enters Q4 at a pivotal inflection point as competing Fed-ECB policy paths and persistent inflation risks collide with major technical support.
This report is intended for general circulation only. It should not be construed as a recommendation, or an offer (or solicitation of an offer) to buy or sell any financial products. The information provided does not take into account your specific investment objectives, financial situation or particular needs. Before you act on any recommendation that may be contained in this report, independent advice ought to be sought from a financial adviser regarding the suitability of the investment product, taking into account your specific investment objectives, financial situation or particular needs.
StoneX Financial Pte. Ltd., may distribute reports produced by its respective foreign entities or affiliates within the StoneX group of companies or third parties pursuant to an arrangement under Regulation 32C of the Financial Advisers Regulations. Where the report is distributed to a person in Singapore who is not an accredited investor, expert investor or an institutional investor (as defined in the Securities Futures Act), StoneX Financial Pte. Ltd. accepts legal responsibility to such persons for the contents of the report only to the extent required by law. Singapore recipients should contact StoneX Financial Pte. Ltd. at 6826 9988 for matters arising from, or in connection with the report.
In the case of all other recipients of this report, to the extent permitted by applicable laws and regulations neither StoneX Financial Pte. Ltd. nor its associated companies will be responsible or liable for any loss or damage incurred arising out of, or in connection with, any use of the information contained in this report and all such liability is hereby expressly disclaimed. No representation or warranty is made, express or implied, that the content of this report is complete or accurate.
StoneX Financial Pte. Ltd. is not under any obligation to update this report.
Trading CFDs carries a high level of risk that may not be suitable for some investors. Consider your investment objectives, level of experience, financial resources, risk appetite and other relevant circumstances carefully. The possibility exists that you could lose some or all of your investments, including your initial deposits. If in doubt, please seek independent expert advice. Visit www.forex.com/en-sg/terms-and-policies for the complete Risk Disclosure Statement.