






'Mini stagflation’ sees USD index, EUR/USD falter at key averages
With inflation and unemployment higher, we have a mini stagflation on our hands. Of course, one set of data points cannot be taken as seriously as stagflation, but it is a trend that could significantly change expectations of the Fed’s monetary policy if this hiccups turns into a trend.
Share this:

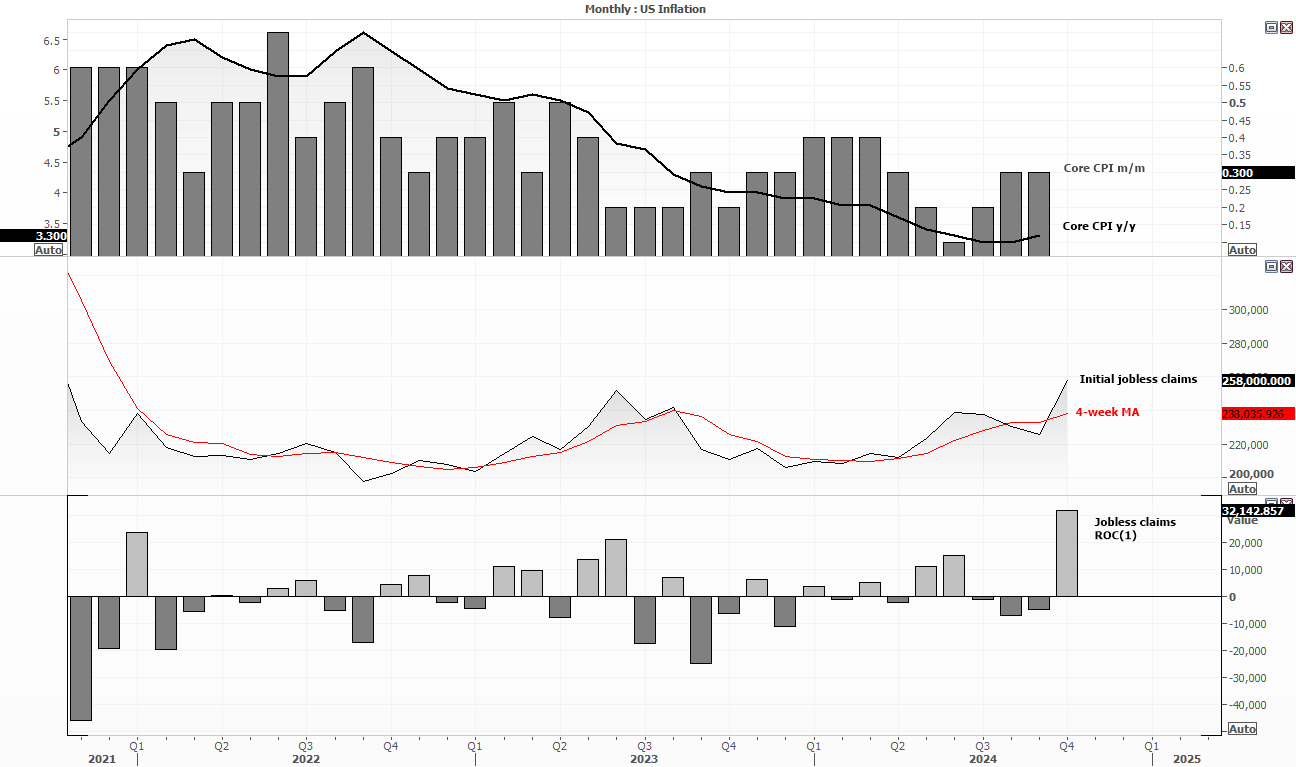
All the focus was on CPI, until an unfavourable employment report which threw a spanner in the works. Based on inflation figures alone we could have been looking at higher yields and USD index today, as core inflation beating expectations on a monthly and annual basis. Core CPI increased at 0.3% m/m compared with 0.2% expected and was up 3.3% y/y versus 3.2% forecast.
However, initial jobless claims came in unexpectedly hot, rising 255k last week – 27k above the 231k expected, or 33k above the prior 225k. That is the largest m/m spike in two years and three months. Perhaps this is just a blip, but also note that the 4-week average is trending higher.
With inflation and unemployment higher, we have a mini stagflation on our hands. Of course, one set of data points cannot be taken as seriously as stagflation, but it is a trend that could significantly change expectations of the Fed’s monetary policy if this hiccups turns into a trend.
The good news is that we only have to wait one week to see if the spike on initial jobless claims is a blip, or the beginning of something more sinister. But traders might take today’s PPI data a bit more seriously given Thursday’s data set.
Wall Street indices took the data within its stride, with the S&P 500, Nasdaq 100 and Down Jones all forming inside day and more or less closing flat for the day. Bond markets took the prospects of weak employment and high inflation more seriously, with the 2-year yield forming a bearish outside day and closing back below 4%, while the 10-year formed a bearish pinbar around the 200-day EMA. The drop in yields saw gold form a bullish engulfing day at the support zone highlighted in yesterday’s report, and the bias for a leg higher remains in place with gold seemingly acting as a safe-haven asset once more.
USD index futures, EUR/USD technical analysis:
The USD index has risen 3% over the past nine days, before it stalled at the 200-day MA, just beneath the 103 handle. An indecision day formed alongside increased volume from the day prior, which can be an indication of a ‘change in hands’ from bulls to bears. The daily RSI (2) had also spent several days overbought, so the rally could be in the need of a pause at the least.
However, the bullish momentum that sent prices here is so strong that we may find any pullback to be limited. Unless the 103 area proves itself to be a repeated area of false breaks (like we saw with bears around 100). So unless incoming US data falls below expectations – particularly employment figures – we may find any such retracement to be limited.
Also note that EUR/USD stalled around my 1.09 downside target, which is near the 200-day EMA. Again, momentum to this point has been very strong which suggest bounce could be limited. Especially if the ECB deliver a dovish cut next week. But for both markets, the move appears to be stretched so bears may want to be cautious around current levels on EUR/USD.
Events in focus (AEDT):
I suspect US PPI figures will garner more attention today given the hot print with CPI figures. There’s not a particularly tight relationship between the two on a per-month basis (a hot print in one does not necessarily equate to a hot print in another), but it could help trigger more of a pullback on the US dollar and yields of it does. And dare I say Wall Street indices may take it a tad more seriously.
- 08:30 – NZ business PMI
- 08:45 – NZ visitors and migrations
- 10:50 – JP money supply
- 17:00 – UK GBP m/m, industrial production, manufacturing production, construction output, trade balance
- 17:00 – DE CPI
- 23:30 – US PPI
- 23:30 – CA employment
View the full economic calendar
View the full economic calendar
-- Written by Matt Simpson
Follow Matt on Twitter @cLeverEdge
How to trade with City Index
You can trade with City Index by following these four easy steps:
- Open an account, or log in if you’re already a customer
• Open an account in the UK
• Open an account in Australia
• Open an account in Singapore
- Search for the market you want to trade in our award-winning platform
- Choose your position and size, and your stop and limit levels
- Place the trade
Related tags:


Open an account in minutes
Experience award-winning platforms with fast and secure execution, and enjoy tight spreads from 0.5 pts on FX and 0.3 pts on indices.
Economic calendar
Web Trader platform
Our sophisticated web-based platform is packed with features.
Related articles
NZD/USD pressure mounts as payrolls looms large
NZD/USD has fallen sharply as Fed rate expectations reset higher, but extreme downside stretch and major support raise the risk of a violent counter-trend rebound.

US Core PCE Preview: Stale or Significant for the Fed
Core PCE inflation takes center stage Wednesday, with traders watching for signs of renewed price pressure and clues on whether the Fed could hike again in October.


Australian Dollar Forecast: AUD/USD Four-Week Slide Nears Critical Uptrend Support 9 29 2026
Aussie momentum has deteriorated sharply into quarter-end, with inflation, Core PCE and NFP on tap as AUD/USD closes in on a pivotal technical threshold.

This report is intended for general circulation only. It should not be construed as a recommendation, or an offer (or solicitation of an offer) to buy or sell any financial products. The information provided does not take into account your specific investment objectives, financial situation or particular needs. Before you act on any recommendation that may be contained in this report, independent advice ought to be sought from a financial adviser regarding the suitability of the investment product, taking into account your specific investment objectives, financial situation or particular needs.
StoneX Financial Pte. Ltd., may distribute reports produced by its respective foreign entities or affiliates within the StoneX group of companies or third parties pursuant to an arrangement under Regulation 32C of the Financial Advisers Regulations. Where the report is distributed to a person in Singapore who is not an accredited investor, expert investor or an institutional investor (as defined in the Securities Futures Act), StoneX Financial Pte. Ltd. accepts legal responsibility to such persons for the contents of the report only to the extent required by law. Singapore recipients should contact StoneX Financial Pte. Ltd. at 6826 9988 for matters arising from, or in connection with the report.
In the case of all other recipients of this report, to the extent permitted by applicable laws and regulations neither StoneX Financial Pte. Ltd. nor its associated companies will be responsible or liable for any loss or damage incurred arising out of, or in connection with, any use of the information contained in this report and all such liability is hereby expressly disclaimed. No representation or warranty is made, express or implied, that the content of this report is complete or accurate.
StoneX Financial Pte. Ltd. is not under any obligation to update this report.
Trading CFDs carries a high level of risk that may not be suitable for some investors. Consider your investment objectives, level of experience, financial resources, risk appetite and other relevant circumstances carefully. The possibility exists that you could lose some or all of your investments, including your initial deposits. If in doubt, please seek independent expert advice. Visit www.forex.com/en-sg/terms-and-policies for the complete Risk Disclosure Statement.