





USD/JPY forecast: Technical Tuesday – May 20, 2025
The USD/JPY is our featured currency pair in this edition of Technical Tuesday. We saw some interesting price action last week, suggesting the pair may have resumes its bearish trend again. The US dollar has also struggled amid quiet conditions, struggling to find the same sort of love equity markets enjoyed amid easing trade tensions. Meanwhile, the narrowing of the spread between the US and Japanese bond yields point to a lower USD/JPY forecast.
Share this:

The USD/JPY is our featured currency pair in this edition of Technical Tuesday. We saw some interesting price action last week, suggesting the pair may have resumes its bearish trend again. The US dollar has also struggled amid quiet conditions, struggling to find the same sort of love equity markets enjoyed amid easing trade tensions. Meanwhile, the narrowing of the spread between the US and Japanese bond yields point to a lower USD/JPY forecast.
USD/JPY Forecast: Dollar on the backfoot
The dollar’s recent slide has extended into this week, albeit marginally, with USD/JPY gently offered as attention shifts to FX policy talks between US and Japanese finance ministers at the G7 meetings in Canada. Markets are trading in a subdued fashion, lacking fresh impetus from the US economic calendar, and are instead leaning into broader macro themes.
There’s little in the way of tier-one US data this week, but there is some speculation that any future US trade agreements in Asia might carry a currency clause, preventing those nations from weakening their currencies. That’s lent strength to a wide range of emerging market currencies.
As far as the USD/JPY forecast is concerned, and with finance chiefs from the US and Japan expected to touch on currency matters, there’s a touch of caution in the air. Japanese policymakers may use the opportunity to raise concerns over excessive yen weakness.
US-Japan yields spread favours USD/JPY downside
While the recent strength in US yields may still favour the dollar, we have seen a bit of the unwinding in the US bond market sell-off, causing long-term yields to dop from their recent highs. Tomorrow’s 20-year US Treasury auction could be a more meaningful driver, especially if yields shift sharply.
On top of this, Japanese 10-year bond yields have also been on the ascendency again. This has caused the yield differential between the US and Japan 10-year bonds to narrow in the favour of the yen. If the spread narrows further, then surely this will further boost the bearish appeal of the USD/JPY forecast.
Technical USD/JPY forecast: Resumption of the downtrend?
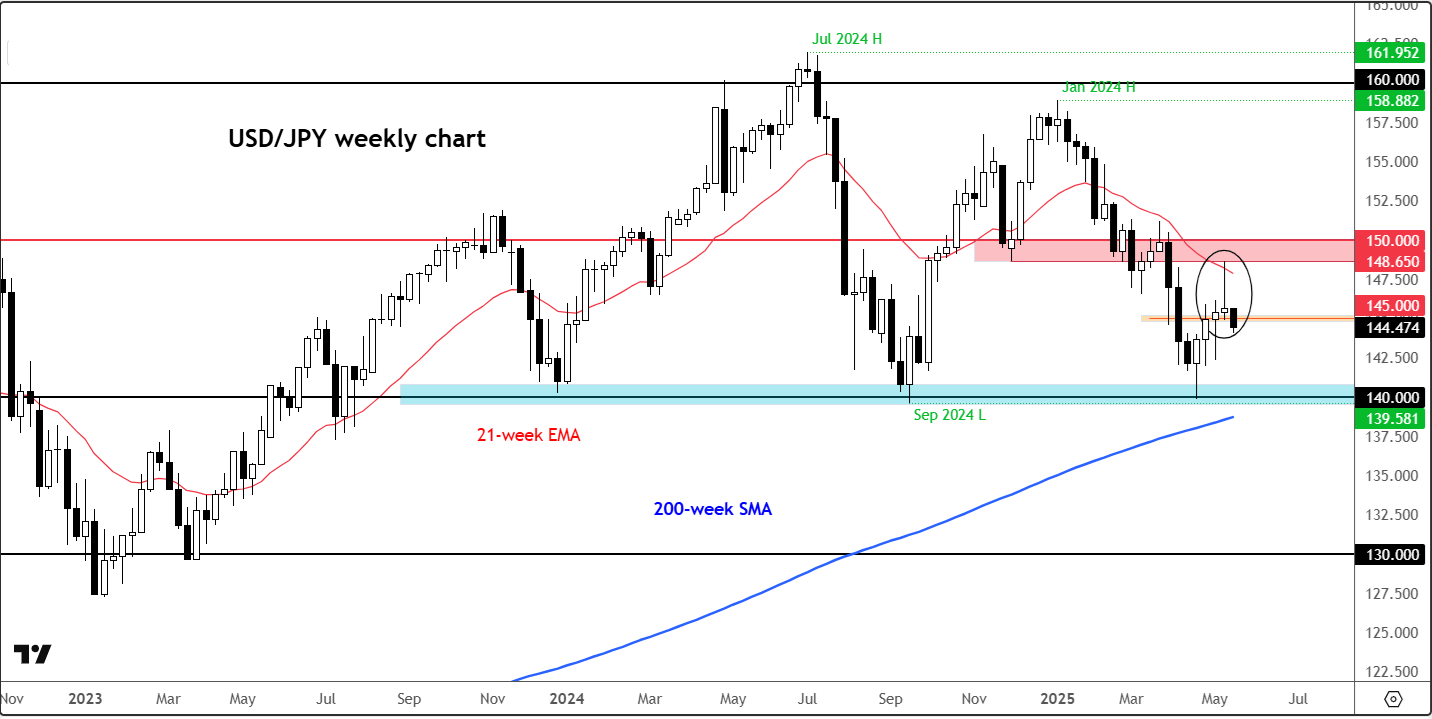
The long-term bullish trend on the weekly and higher time frames of the USD/JPY ended in July 2024 when rates repeatedly failed to hold the breakout above 160.00 handle. Since then, we have seen at least two periods of extended declines: once last summer when the unwinding of the carry trade was the theme, and once at the start of this year, when trade war concerns boosted the appeal of the haven yen. In the last several weeks, we saw the USD/JPY stage an impressive recovery as it found good support from around the 140.00 handle and made its way past 148.00 at one stage, before ease lower again. This upsurge was directly in response to the easing of trade tensions, which saw global equity markets rally hard. But it looks like that bullish momentum for the USD/JPY came to a halt last week. The key question now is whether that was a mere pause before more gains are followed, or has the downward trend resumed?
USD/JPY key levels to watch
Looking at the weekly chart of the USD/JPY, one can observe that an inverted hammer candle was formed last week when rates tested – and reversed from – the bottom range of a key resistance zone between 148.65 to 150.00. This area is shaded in red on the chart. The fact that resistance held here suggests that the bearish trend that began last summer may have now resumed. This thesis will remain valid particularly while rates now hold below the low of the previous week’s range and interim resistance around 145.00. The bears will now want to defend this level to exert further pressure if they want to revisit the 140.00 area again. However, if we see a mid-week bullish reversal and rates go back above 145.00, then that would put the bears in a spot of bother. So, they key level to watch now is at 145.00 on the upside.
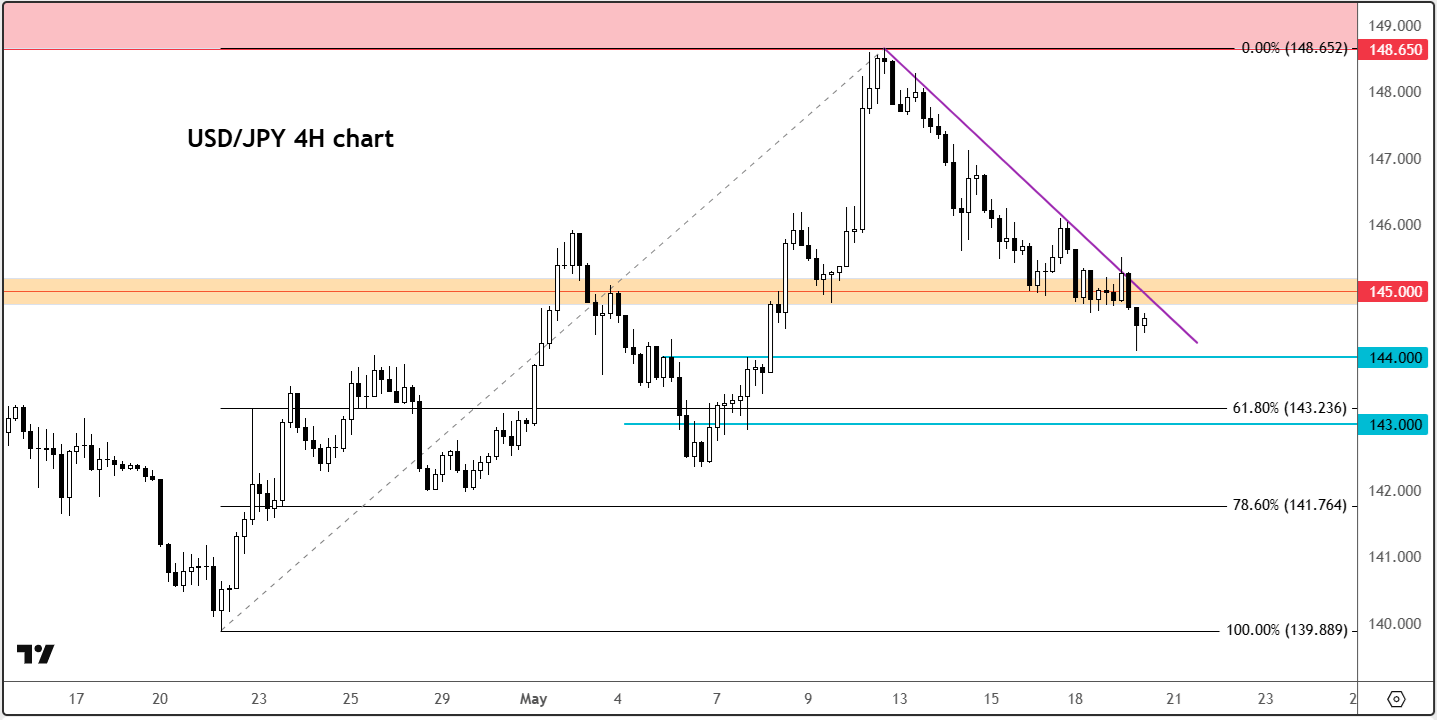
Meanwhile, if the downward pressure persists, watch out for possible short-term bounces around round handles like 144.00, 143.00 etc.
Additionally, as shown on the USD/JPY 4H chart, there are potential support areas around the 61.8% (143.24) and 78.6% (141.76) Fibonacci retracement levels against the most recent low (139.89) that also need to be watched.
Bottom Line: USD/JPY could continue to edge lower this week, especially if the G7 discussions produce any FX-related headlines. With emerging market currencies catching a bid and the dollar losing steam amid speculative trade chatter, the balance of risks points towards modest yen strength in the near term.
Source for all charts used in this article: TradingVIew.com
-- Written by Fawad Razaqzada, Market Analyst
Follow Fawad on Twitter @Trader_F_R
How to trade with City Index
You can trade with City Index by following these four easy steps:
- Open an account, or log in if you’re already a customer
• Open an account in the UK
• Open an account in Australia
• Open an account in Singapore
- Search for the company you want to trade in our award-winning platform
- Choose your position and size, and your stop and limit levels
- Place the trade
Latest market news




Open an account in minutes
Experience award-winning platforms with fast and secure execution, and enjoy tight spreads from 0.5 pts on FX and 0.3 pts on indices.
Economic calendar
Web Trader platform
Our sophisticated web-based platform is packed with features.
Related articles
Gold Q4 2026 outlook: Resilience in the face of rallying dollar and yields
As we headed towards the latter stages of Q3 and into Q4, the Fed had just hiked rates in a hawkish FOMC meeting, while the likes of the ECB and BoJ had also tightened their respective policies. Oil prices remained elevated amid the prolonged US-Iran conflict. Meanwhile, bond yields were breaking out, and the dollar was higher across the board. Yet, remarkably, gold was still holding in the positive territory for the third quarter, even if it had weakened somewhat in September.
EUR/USD Q4 2026 Outlook: Euro at a Crossroads as Fed, ECB Tighten 9 25 2026
EUR/USD enters Q4 at a pivotal inflection point as competing Fed-ECB policy paths and persistent inflation risks collide with major technical support.

AUD/USD Q4 Outlook: RBA and Fed Hikes Set the Tone
AUD/USD enters Q4 with RBA and Fed hikes in focus as sticky inflation, rising unemployment and US dollar strength shape the Australian dollar.

This report is intended for general circulation only. It should not be construed as a recommendation, or an offer (or solicitation of an offer) to buy or sell any financial products. The information provided does not take into account your specific investment objectives, financial situation or particular needs. Before you act on any recommendation that may be contained in this report, independent advice ought to be sought from a financial adviser regarding the suitability of the investment product, taking into account your specific investment objectives, financial situation or particular needs.
StoneX Financial Pte. Ltd., may distribute reports produced by its respective foreign entities or affiliates within the StoneX group of companies or third parties pursuant to an arrangement under Regulation 32C of the Financial Advisers Regulations. Where the report is distributed to a person in Singapore who is not an accredited investor, expert investor or an institutional investor (as defined in the Securities Futures Act), StoneX Financial Pte. Ltd. accepts legal responsibility to such persons for the contents of the report only to the extent required by law. Singapore recipients should contact StoneX Financial Pte. Ltd. at 6826 9988 for matters arising from, or in connection with the report.
In the case of all other recipients of this report, to the extent permitted by applicable laws and regulations neither StoneX Financial Pte. Ltd. nor its associated companies will be responsible or liable for any loss or damage incurred arising out of, or in connection with, any use of the information contained in this report and all such liability is hereby expressly disclaimed. No representation or warranty is made, express or implied, that the content of this report is complete or accurate.
StoneX Financial Pte. Ltd. is not under any obligation to update this report.
Trading CFDs carries a high level of risk that may not be suitable for some investors. Consider your investment objectives, level of experience, financial resources, risk appetite and other relevant circumstances carefully. The possibility exists that you could lose some or all of your investments, including your initial deposits. If in doubt, please seek independent expert advice. Visit www.forex.com/en-sg/terms-and-policies for the complete Risk Disclosure Statement.