









USD/JPY, Nasdaq 100: AI-Driven Shakeout Stirs Parallels to January
With USD/JPY sliding and Nasdaq 100 futures breaking trend support, the AI-fueled market shakeout may not be done yet. Will payrolls change the tide—or add to the chaos?
Share this:

- USD/JPY slides below 148.65, eyes key support at 147.20 as yen strengthens
- Nasdaq 100 futures close below 200DMA for the first time since March 2023
- Tech losses weigh on carry trades, raising risk of capitulation selling
- All eyes on payrolls, but AI-driven selling could override fundamentals
DeepSeek 2.0?
Is China’s emergence as an AI superpower about to spark another sharp selloff in USD/JPY and the Nasdaq 100, similar to the deep drawdown seen earlier this year when DeepSeek rattled U.S. tech valuations? No one knows for sure, but price action in FX and U.S. equity futures on Thursday suggests the risks may be building after Alibaba unveiled QwQ-32B, a new AI reasoning model it claims can rival DeepSeek’s R1.
Alibaba’s announcement sent its Hong Kong-listed shares soaring over 8% to fresh multi-year highs, but what stood out was the weakness in Nasdaq 100 and S&P 500 futures in Asia, hinting at early selling pressure in U.S. tech. Things got even more interesting heading into the European handover, with USD/JPY erasing earlier gains to slide below 148.65—an important technical level that had attracted dip buying over the past two weeks.
Correlations Converge
Source: TradingView
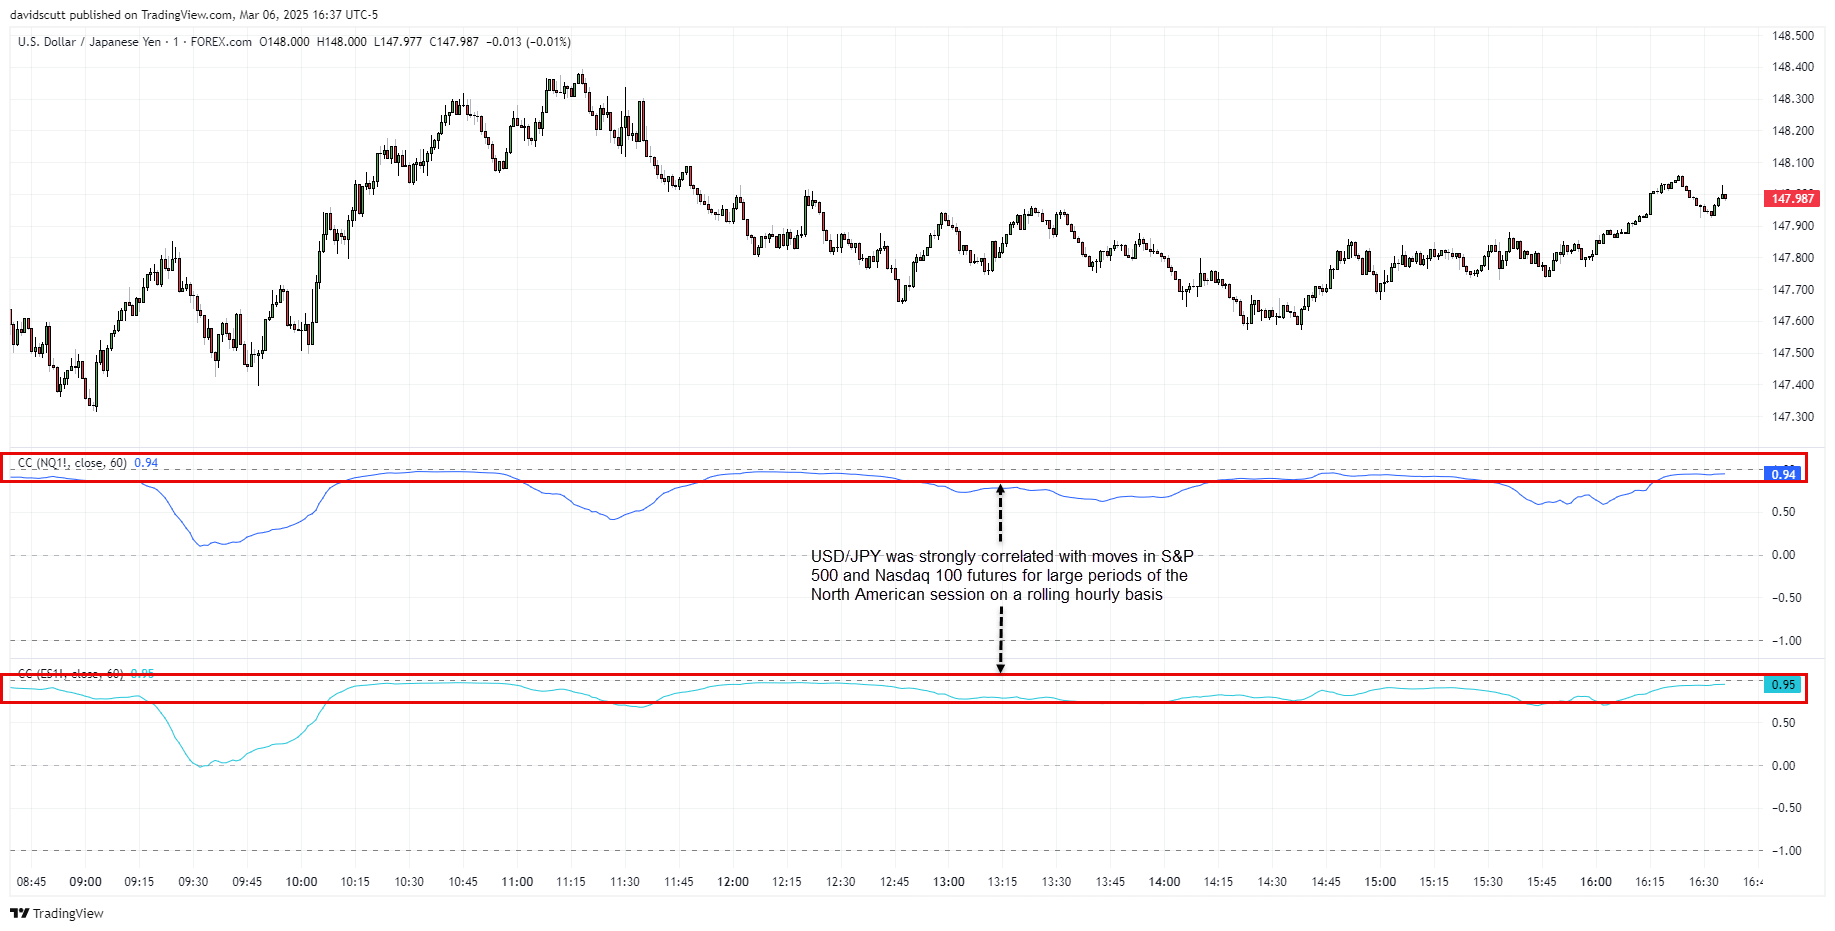
As the yen rallied, U.S. stock futures tumbled, with the one-minute correlation between USD/JPY and S&P 500/Nasdaq 100 futures holding above 0.9 for much of the U.S. session on a rolling hourly basis. While higher bond yields, uncertainty over U.S. trade policy, and potential capitulation selling may have contributed, it’s hard to ignore parallels with the DeepSeek-driven rout in January.
While USD/JPY’s relationship with rate differentials remains intact—making Friday’s U.S. non-farm payrolls a key risk event—it’ll be worth watching whether the pair resumes its downward march in Asia.
USD/JPY Resumes Bear Trend
Source: TradingView
Having closed at its lowest level since October after overwhelming bids beneath 148.65, and with downside momentum building, USD/JPY bears will be eyeing another run toward key support at 147.20 today. The pair came close to testing the level on Thursday before reversing higher, but that may not be enough to deter shorts, even with payrolls looming. With U.S. tech losses pressuring yen carry trades, the risk of capitulation selling could easily override fundamental data in the short term.
A break of 147.20 would put 144.23 in focus, given the significance of this level in September and October last year. On the topside, 148.65 may now act as resistance, with 151 a more substantial barrier beyond that.
Nasdaq 100 Slammed Below 200DMA
Source: TradingView
Adding to the increasingly bearish outlook for U.S. tech, Nasdaq 100 futures closed below the 200-day moving average on Thursday for the first time since March 2023. Given how sharply the index has rebounded from this level in the past two years, the bearish close raises the risk of a potential trend shift. However, a meaningful break of uptrend support, currently just below 19,900, is needed for confirmation.
Horizontal support sits either side at 20,010 and 19,850, with a break below all three likely to spark further selling. If that unfolds, 19,575 and 19,150 come into view. On the other hand, if the uptrend holds, traders should watch the 200DMA, 20,720, and 21,000 as key upside levels.
Adding to the sense that tech may be at an important juncture, traded volumes have picked up over the past fortnight, suggesting there are still plenty of willing buyers despite increasingly bearish price action. While MACD remains firmly bearish, a slight RSI divergence from price hints that selling momentum may be starting to wane.
-- Written by David Scutt
Follow David on Twitter @scutty
How to trade with City Index
You can trade with City Index by following these four easy steps:
- Open an account, or log in if you’re already a customer
• Open an account in the UK
• Open an account in Australia
• Open an account in Singapore
- Search for the market you want to trade in our award-winning platform
- Choose your position and size, and your stop and limit levels
- Place the trade
Related tags:
Latest market news




Open an account in minutes
Experience award-winning platforms with fast and secure execution, and enjoy tight spreads from 0.5 pts on FX and 0.3 pts on indices.
Economic calendar
Web Trader platform
Our sophisticated web-based platform is packed with features.
Related articles
Gold Q4 2026 outlook: Resilience in the face of rallying dollar and yields
As we headed towards the latter stages of Q3 and into Q4, the Fed had just hiked rates in a hawkish FOMC meeting, while the likes of the ECB and BoJ had also tightened their respective policies. Oil prices remained elevated amid the prolonged US-Iran conflict. Meanwhile, bond yields were breaking out, and the dollar was higher across the board. Yet, remarkably, gold was still holding in the positive territory for the third quarter, even if it had weakened somewhat in September.
EUR/USD Q4 2026 Outlook: Euro at a Crossroads as Fed, ECB Tighten 9 25 2026
EUR/USD enters Q4 at a pivotal inflection point as competing Fed-ECB policy paths and persistent inflation risks collide with major technical support.

Equity Indices Q4, 2026 Outlook: Cracks Begin to Show
There's still an open door for a melt-up in the S&P 500 and Nasdaq but the Dow and Russell 2000 are looking more vulnerable, and until calm hits the Treasuries market there's a higher probability for volatility. The big question is whether that's a next quarter theme or not.

This report is intended for general circulation only. It should not be construed as a recommendation, or an offer (or solicitation of an offer) to buy or sell any financial products. The information provided does not take into account your specific investment objectives, financial situation or particular needs. Before you act on any recommendation that may be contained in this report, independent advice ought to be sought from a financial adviser regarding the suitability of the investment product, taking into account your specific investment objectives, financial situation or particular needs.
StoneX Financial Pte. Ltd., may distribute reports produced by its respective foreign entities or affiliates within the StoneX group of companies or third parties pursuant to an arrangement under Regulation 32C of the Financial Advisers Regulations. Where the report is distributed to a person in Singapore who is not an accredited investor, expert investor or an institutional investor (as defined in the Securities Futures Act), StoneX Financial Pte. Ltd. accepts legal responsibility to such persons for the contents of the report only to the extent required by law. Singapore recipients should contact StoneX Financial Pte. Ltd. at 6826 9988 for matters arising from, or in connection with the report.
In the case of all other recipients of this report, to the extent permitted by applicable laws and regulations neither StoneX Financial Pte. Ltd. nor its associated companies will be responsible or liable for any loss or damage incurred arising out of, or in connection with, any use of the information contained in this report and all such liability is hereby expressly disclaimed. No representation or warranty is made, express or implied, that the content of this report is complete or accurate.
StoneX Financial Pte. Ltd. is not under any obligation to update this report.
Trading CFDs carries a high level of risk that may not be suitable for some investors. Consider your investment objectives, level of experience, financial resources, risk appetite and other relevant circumstances carefully. The possibility exists that you could lose some or all of your investments, including your initial deposits. If in doubt, please seek independent expert advice. Visit www.forex.com/en-sg/terms-and-policies for the complete Risk Disclosure Statement.