



USD/JPY Pulls Back as Yields, USD Fall on Treasury Buyback Announcement
It was a busy morning as a surprise announcement of increased Treasury buybacks sent yields down which had a reverberative effect across many macro markets, USD/JPY included.
Share this:

USD/JPY Talking Points:
- As looked at in yesterday’s webinar USD/JPY is still very much a cat and mouse game, with positive carry on the long side of the pair but a very visible intervention from the BoJ and perhaps more powerfully the US Treasury Department.
- USD/JPY started the day pushing towards 160.00 but the announcement helped to draw a pullback, and the pair is now holding support at a familiar area around the 158 handle.
- While it’s clear that both the UST and BoJ would like to see a weaker spot rate for the pair, longs have continued to hold on until greater evidence of a fundamental shift appears – or unless either economy takes more convincing direct action – there could be a case for short-term bullish trend strategies as buyers have continued to bid pullbacks.

USD/JPY retreated to a familiar area today with the 158 zone quickly coming back into play. This broke a streak of higher-lows and the pair was stepping closer to the 160.00 level before the pullback appeared. And while the earlier announcement of increased Treasury buybacks does make for a less attractive backdrop for long USD and, in-turn, long USD/JPY, the fundamental deviation in the pair continues to exist and this can keep bulls bidding support in the near-term, although it highlights a growing issue for USD/JPY traders.
With both the BoJ and US Treasury Department stepping in on the matter, it’s clear that both want to see lower spot rates in the pair. Now, like I said just after the intervention, that didn’t necessarily obviate 155 as support, as it was unlikely that we would see continued intervention after such a steep fall. But – it does provide for a theoretical cap to upside, as re-approaching those prior highs at 164 or perhaps even just re-approaching the 160 level could elicit such a swing from policymakers.
We saw that dynamic at work as buyers continually stalled before a 160.00 test, but, like I showed in the webinar yesterday without some form of shock it was likely that bulls would eventually go for that test. Well, the shock arrived this morning and now the big question is whether it’s enough to frighten longer-term position holders into closing long USD/JPY positions and going flat.
USD/JPY Daily Chart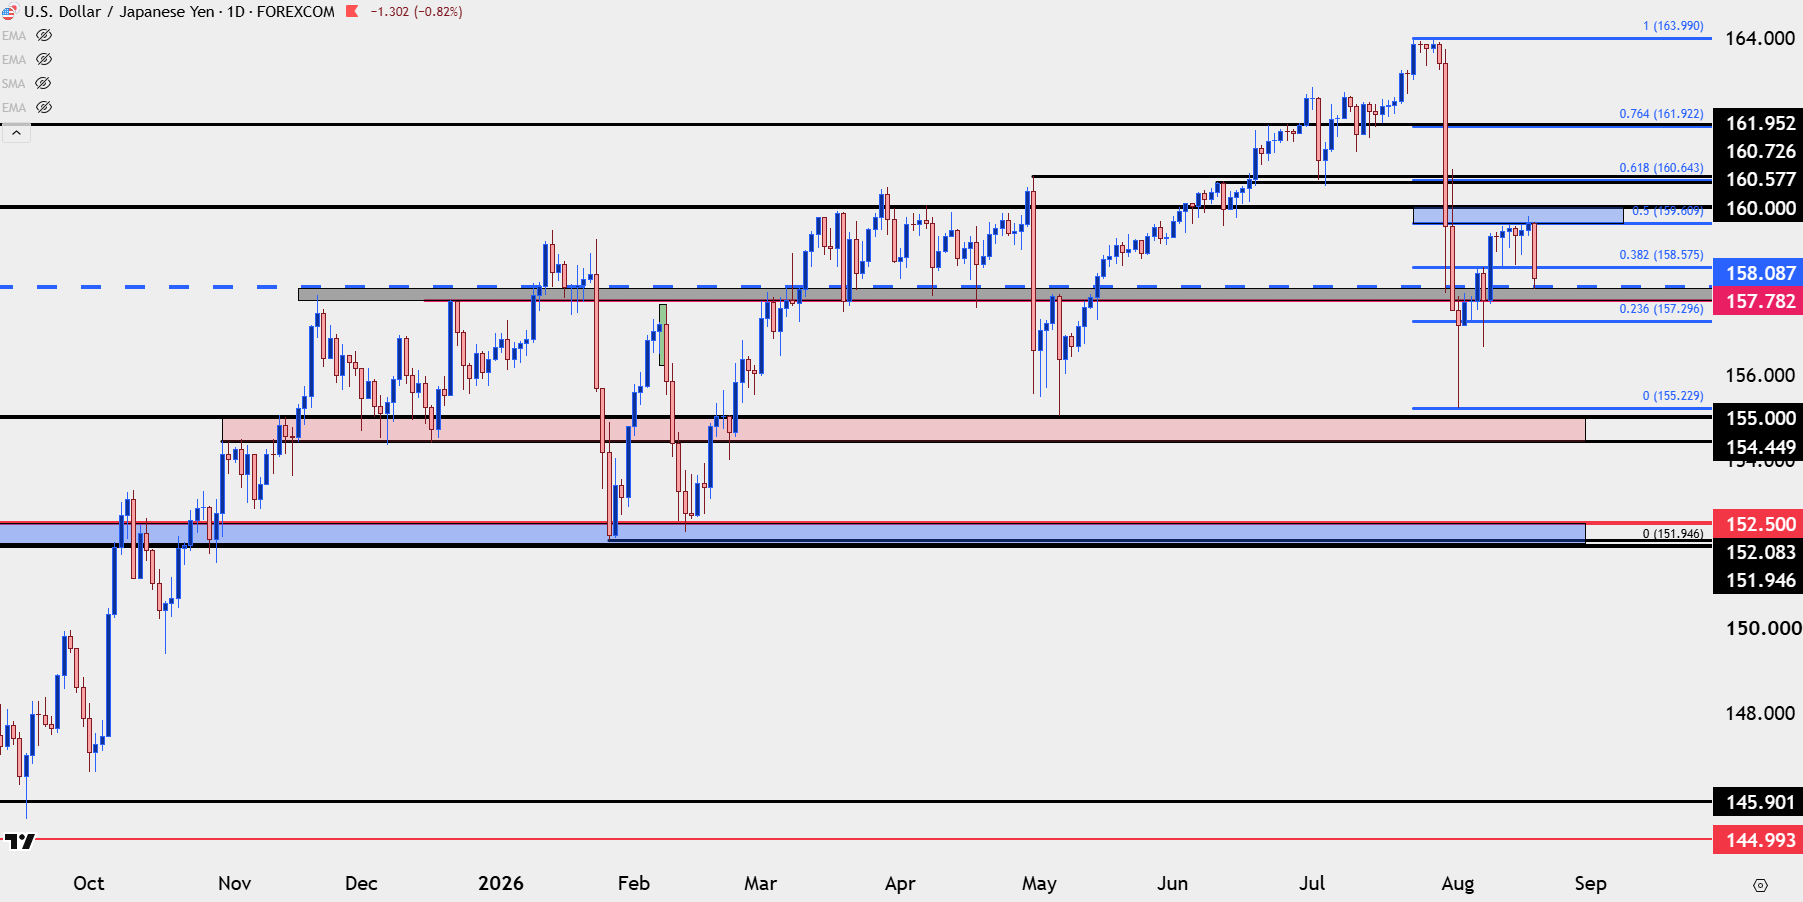
Chart prepared by James Stanley; data derived from Tradingview
USD/JPY Where Does the Shift Begin to Show?
Tomorrow afternoon brings a CPI print out of Japan and that can take on newfound importance. While expected at 1.8%, prior rumors of a rate hike from the Bank of Japan could be bolstered by stronger inflation, which could then serve to provide another shock factor to longs holding positions.
As I covered in the past, interventions can be great for stalling rallies but for eliciting reversals, at least in the recent past, there’s needed to be a shift in the fundamentals or the perceived fundamentals between the two economies. And with US inflation at 3.4% against last month’s 1.7% in Japan, that deviation just did not exist, and still doesn’t, really.
But, the more weakness that shows in US data or the more strength that shows in Japanese inflation and that relationship can shift to the point where longs suddenly want to cut bait.
But, perhaps more importantly, prices aren’t a perfect manifestation of fundamentals, and it’s the positioning in the market that matters most. Likely, at this point, there’s probably a considerable number of stops sitting below the 155.00 handle and if those stops get hit, that’s an oncoming rush of supply that could quickly send the pair spiraling lower. That would expose the next zone below that at 151.95 and there’s probably even more stops sitting below that, as the prior 2022 and 2023 high was back in as support in February of this year.
USD/JPY Daily Chart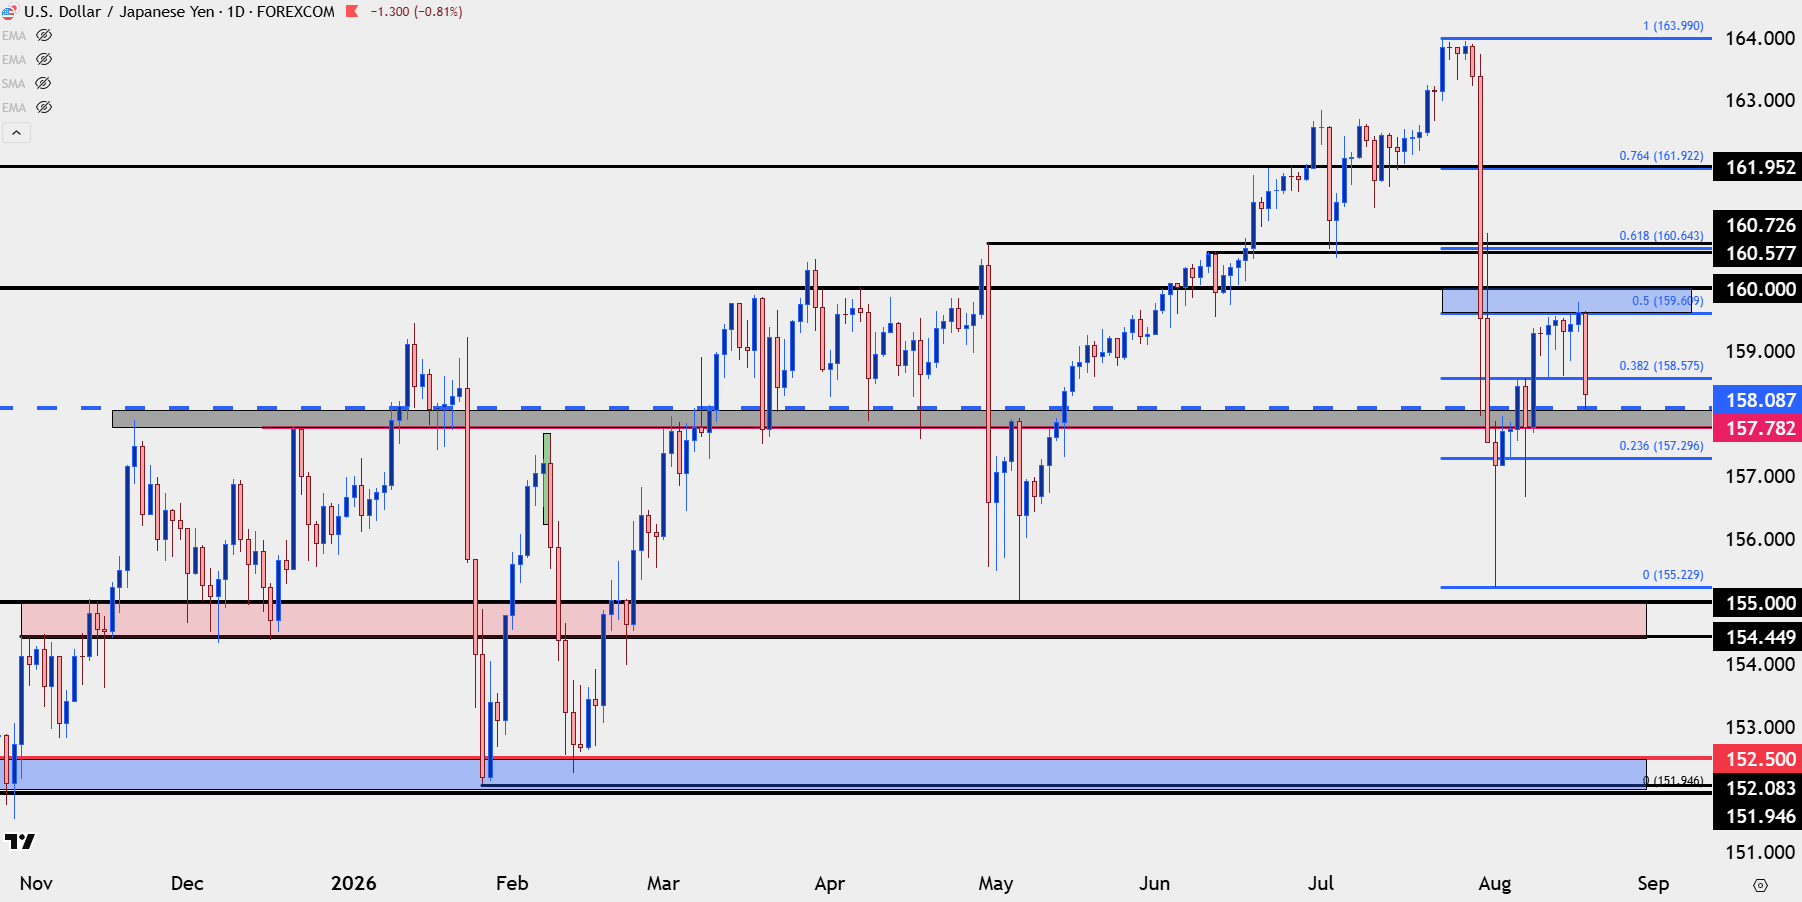
Chart prepared by James Stanley; data derived from Tradingview
USD/JPY Shorter-Term
Given the newness of the shock perspective is often helpful. But, noticing differences is, too, and at this stage, one important distinction between the support test at 158.08 and prior bounces is the fact that sellers have so far faded the move. And from a structural perspective, there’s been resistance at prior support, around the 38.2% Fibonacci retracement of the recent sell-off.
That’s an important difference because it highlights waning enthusiasm and it may be showing us that longer-term longs are using this bounce to wiggle out of positions before a perceived steeper fall.
Below 158.08 there’s another swing level at 157.78, after which the 23.6% retracement from that same major move appears at 157.30. And if we see a breach of both levels, a behavioral change will seem more likely as the prior ‘buy the dip’ backdrop is giving way to ‘sell the rip.’
USD/JPY Hourly Chart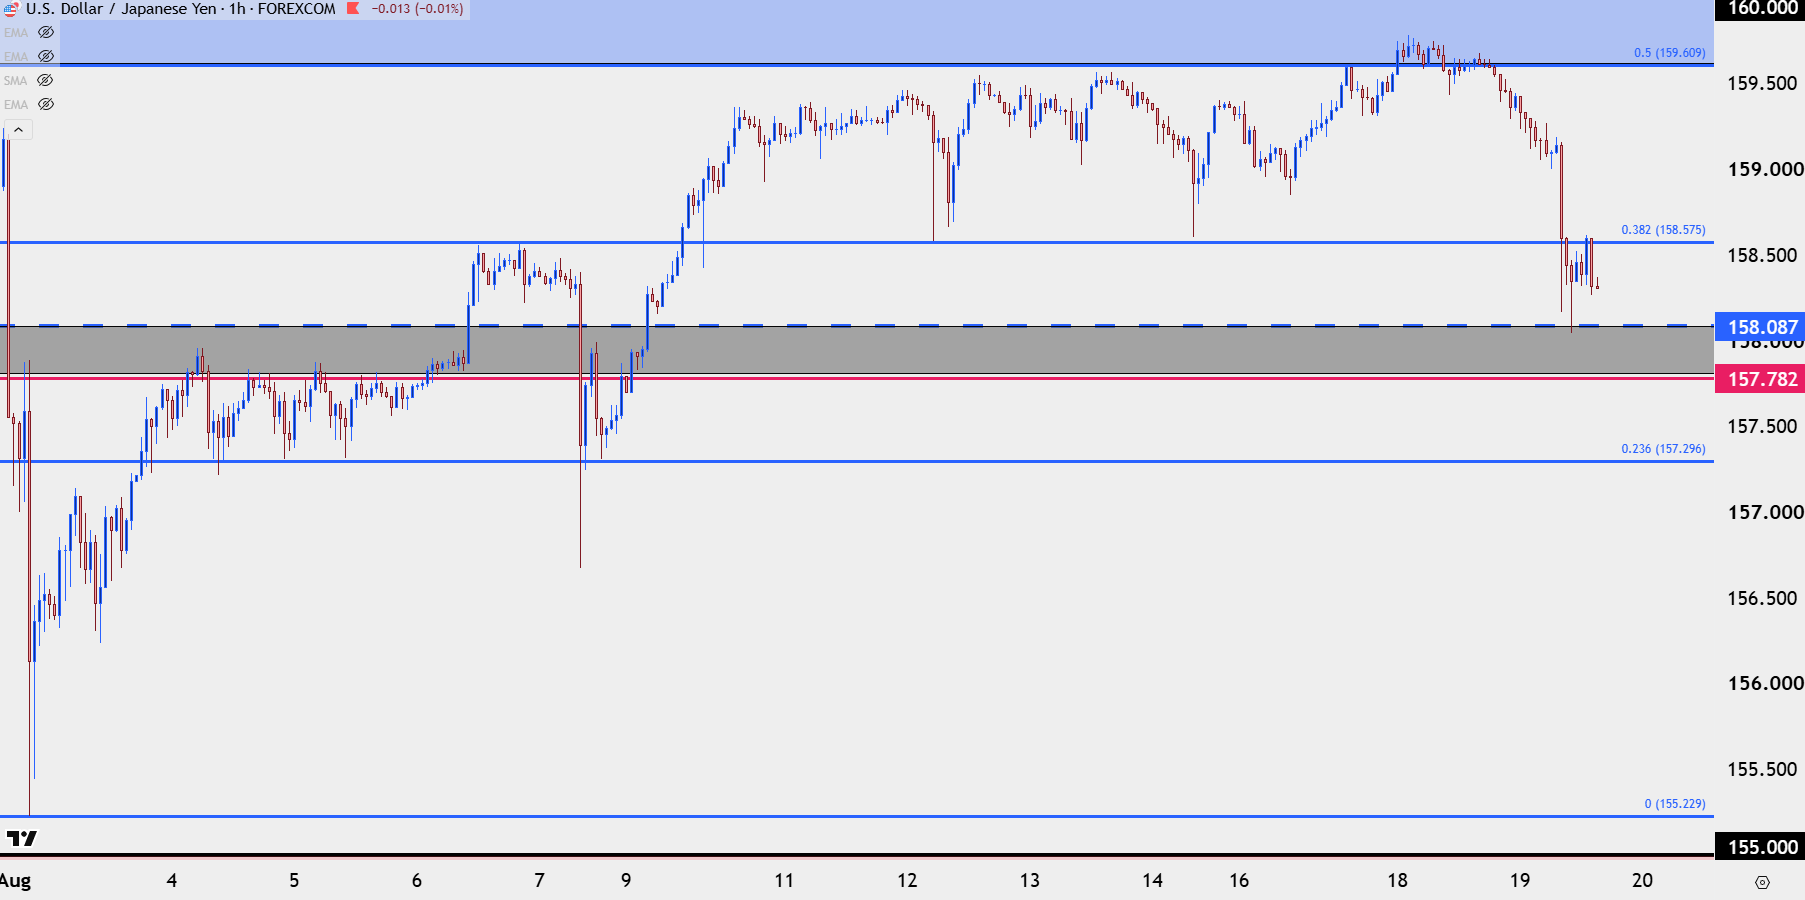
Chart prepared by James Stanley; data derived from Tradingview
--- written by James Stanley, Senior Market Analyst, Global Macro
Related tags:

Open an account in minutes
Experience award-winning platforms with fast and secure execution, and enjoy tight spreads from 0.5 pts on FX and 0.3 pts on indices.
Economic calendar
Web Trader platform
Our sophisticated web-based platform is packed with features.
Related articles

Oil, USD/JPY Forecast: Two trades to watch
Oil recovers above $90 amid a lack of progress in US-Iran diplomacy. USD/JPY rises to 158 on widening Fed-BoJ policy outlook.


USD/JPY outlook: Hawkish Fed recalibration pressures the yen
Stronger US growth momentum and rising Treasury yields are keeping USD/JPY pointed higher, even as Japanese policymakers try to limit the pressure building across domestic markets.


USD/JPY Bulls Continue to Push as Markets ‘Bet Against the House’
USD/JPY is now up by more than 500 pips from the low taken the day that Scott Bessent taunted markets, saying ‘you can bet against me if you want.’
This report is intended for general circulation only. It should not be construed as a recommendation, or an offer (or solicitation of an offer) to buy or sell any financial products. The information provided does not take into account your specific investment objectives, financial situation or particular needs. Before you act on any recommendation that may be contained in this report, independent advice ought to be sought from a financial adviser regarding the suitability of the investment product, taking into account your specific investment objectives, financial situation or particular needs.
StoneX Financial Pte. Ltd., may distribute reports produced by its respective foreign entities or affiliates within the StoneX group of companies or third parties pursuant to an arrangement under Regulation 32C of the Financial Advisers Regulations. Where the report is distributed to a person in Singapore who is not an accredited investor, expert investor or an institutional investor (as defined in the Securities Futures Act), StoneX Financial Pte. Ltd. accepts legal responsibility to such persons for the contents of the report only to the extent required by law. Singapore recipients should contact StoneX Financial Pte. Ltd. at 6826 9988 for matters arising from, or in connection with the report.
In the case of all other recipients of this report, to the extent permitted by applicable laws and regulations neither StoneX Financial Pte. Ltd. nor its associated companies will be responsible or liable for any loss or damage incurred arising out of, or in connection with, any use of the information contained in this report and all such liability is hereby expressly disclaimed. No representation or warranty is made, express or implied, that the content of this report is complete or accurate.
StoneX Financial Pte. Ltd. is not under any obligation to update this report.
Trading CFDs carries a high level of risk that may not be suitable for some investors. Consider your investment objectives, level of experience, financial resources, risk appetite and other relevant circumstances carefully. The possibility exists that you could lose some or all of your investments, including your initial deposits. If in doubt, please seek independent expert advice. Visit www.forex.com/en-sg/terms-and-policies for the complete Risk Disclosure Statement.