







USD/JPY slips to multi-month lows, AUD/USD tests major resistance
As market depth thins into Easter, AUD/USD and USD/JPY are lining up for potentially explosive moves. With big data and central bank risks ahead, traders should watch the near-term price action closely.
Share this:

- USD/JPY closes below 142.00 despite strong U.S. retail sales
- AUD/USD near key resistance ahead of Aussie jobs report
- ECB guidance on euro strength may rattle FX markets
- Thin liquidity heightens risk of sharp moves across majors
Summary
USD/JPY and AUD/USD sit at key levels on the charts heading into what is traditionally a period of poor market liquidity ahead of Easter. With unemployment data to navigate in Australia and several major risk events later in the session—headlined by the European Central Bank’s April rate decision where guidance will drive direction—the prospect of heightened market volatility is in place even before headline risk related to U.S. trade policy is considered.
USD/JPY Breaches 142.00
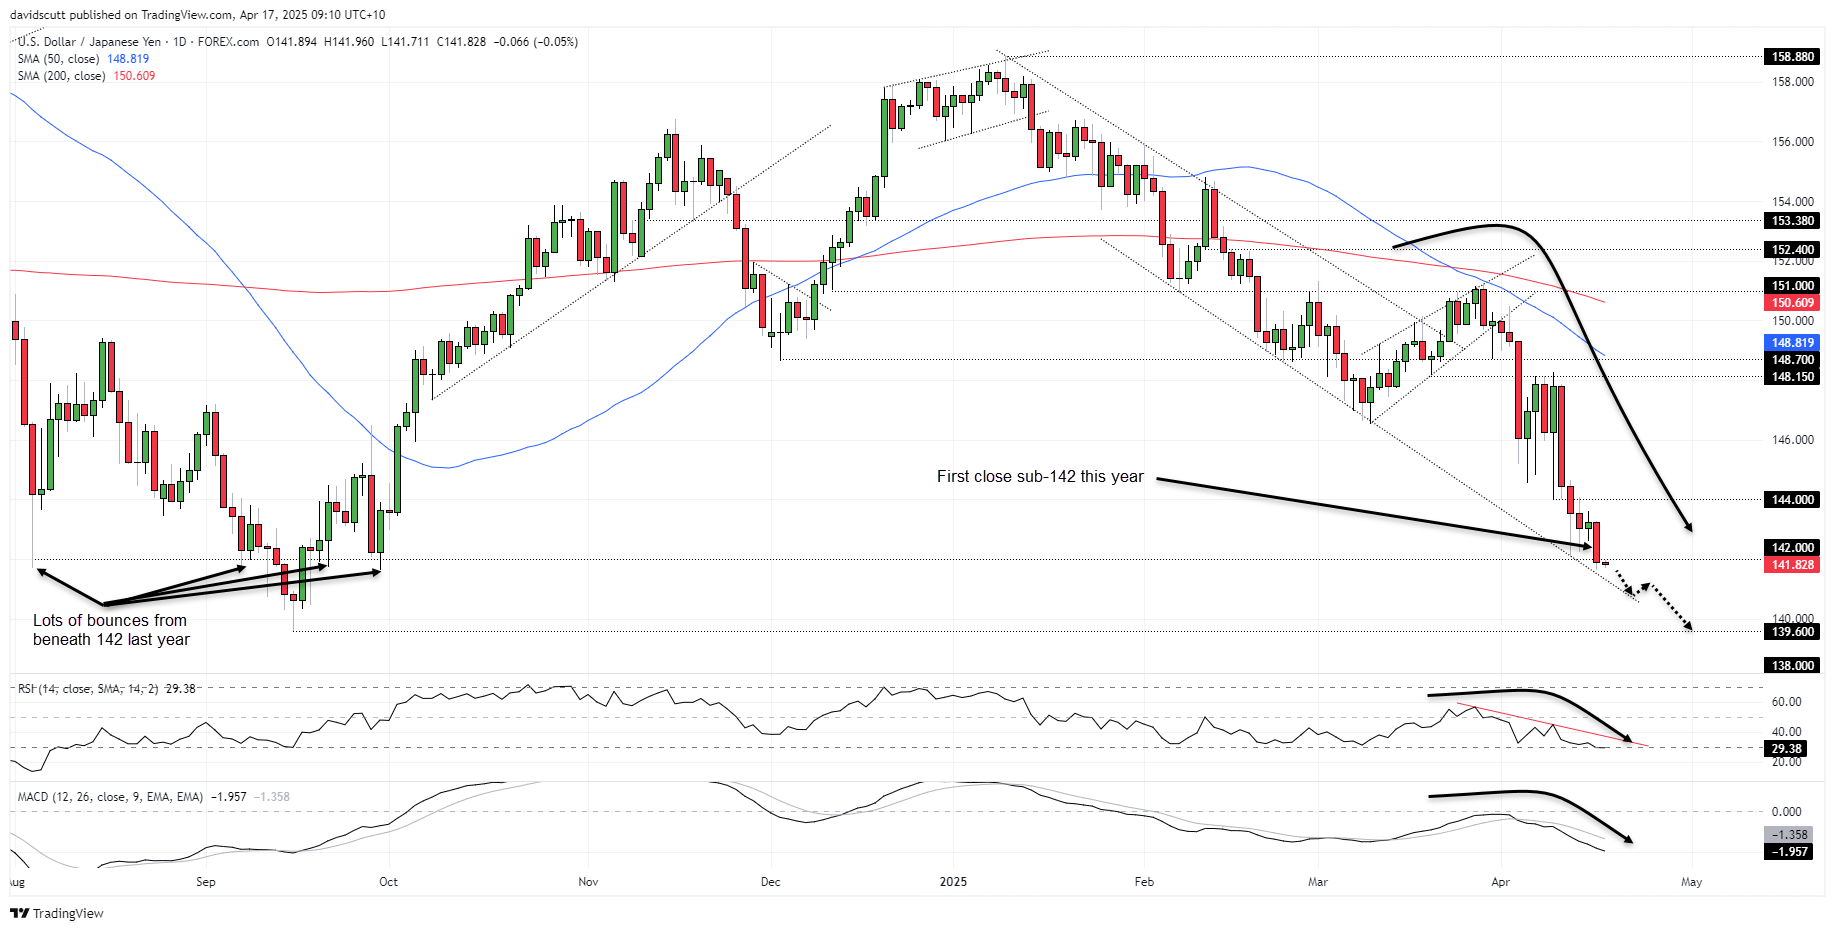
After a brief pause on Tuesday, the slide in USD/JPY resumed on Wednesday as news broke of further export restrictions on NVIDIA’s H20 chips to China, kicking off another wave of dollar selling in Asia. Not even a stronger-than-expected U.S. retail sales report or neutral remarks from Federal Reserve Chair Jerome Powell were enough to support the buck, seeing USD/JPY close at the lowest level since September 2024.
Source: TradingView
Looking at USD/JPY on the daily chart, the close beneath the important 142.00 level looms as significant considering how many times the pair bounced from it during August and September last year. The only time we saw a successful breach was on September 12, 2024, resulting on that occasion in USD/JPY sliding to 139.60. If the break and close beneath 142.00 can be sustained in Asian trade today, it may embolden bears to look for a similar outcome on this occasion.
Aside from 142.00, downtrend support dating back to February is another level for traders to keep an eye on, especially as we’ve seen more than a handful of bounces from it since it was established. Today, the trendline is found around 141.30. If the downside break fails to be sustained, 144.00 is a level of note above.
Momentum indicators remain firmly in the sell-on-rallies camp, with bearish momentum in RSI (14) and MACD continuing to grow. While that skews directional risks towards the downside, the risk of a countertrend squeeze remains elevated with RSI (14) now sitting beneath 30. Any good news on the trade negotiation front could be the catalyst for such a move.
AUD/USD Bullish Momentum Slows
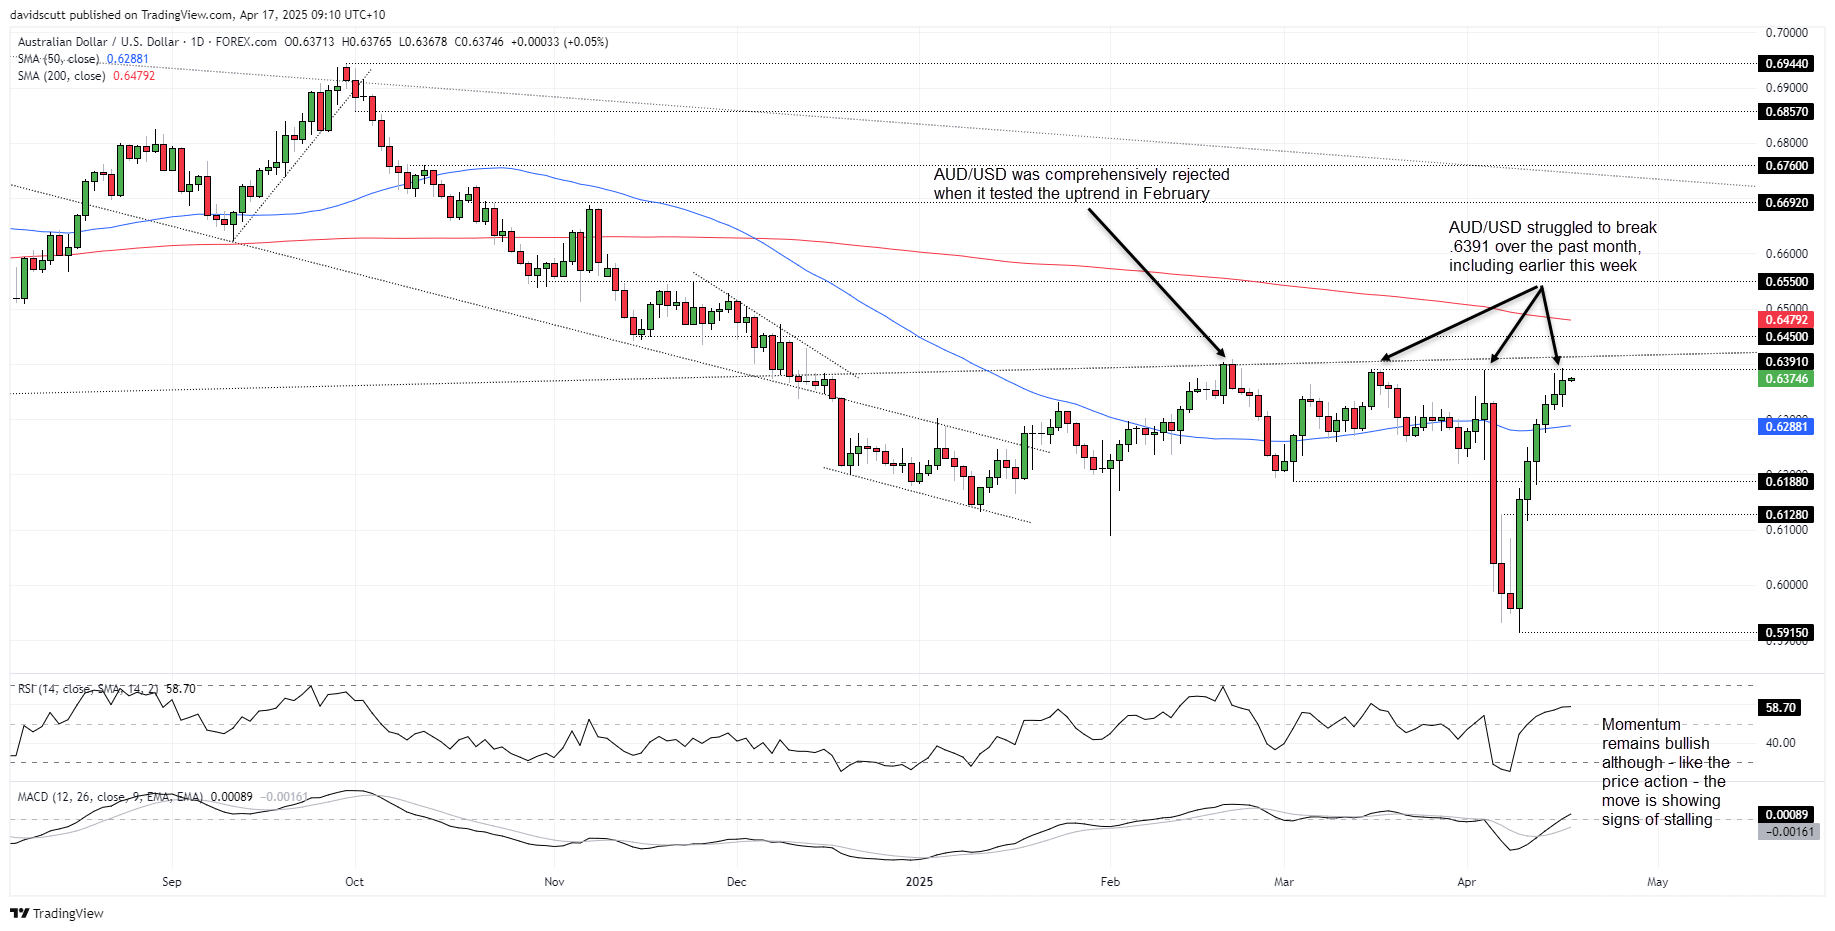
The Australian dollar is also eyeing fresh cyclical highs against the U.S. dollar today, sitting just beneath a key zone comprising horizontal resistance at .6391 and uptrend resistance currently located around .6415. The latter was established in October 2022 and formerly acted as support. Since being broken, AUD/USD has only been tested once and was categorically rejected. It’s therefore important technically.
Source: TradingView
While the momentum picture points to upside risks, with RSI (14) and MACD both moving higher above neutral levels, the bullish advance is showing signs of slowing, underlining the need to see bullish price signals to add to the move already seen. Indeed, another failure at .6391 may shift directional risks lower, not higher.
If AUD/USD were to break above the October 2022 uptrend, .6450, the 200-day moving average and .6550 are levels that bulls may target. Beneath .6391, a bearish reversal would put the 50-day moving average and .6188 on the radar for shorts.
Providing a potential catalyst to dictate medium-term directional risks, Australia’s March employment report will be released at 11.30am AEST. Employment is expected to lift by 40,000 after an even larger fall in February. Unemployment is seen lifting a tenth to 4.2%, driven by disruptions caused by Cyclone Alfred early in the month.
While the unemployment rate is the most important figure for the RBA, markets typically react to the jobs figure first as it has a knack for delivering extreme volatility.
-- Written by David Scutt
Follow David on Twitter @scutty
How to trade with City Index
You can trade with City Index by following these four easy steps:
- Open an account, or log in if you’re already a customer
• Open an account in the UK
• Open an account in Australia
• Open an account in Singapore
- Search for the market you want to trade in our award-winning platform
- Choose your position and size, and your stop and limit levels
- Place the trade
Related tags:
Latest market news




Open an account in minutes
Experience award-winning platforms with fast and secure execution, and enjoy tight spreads from 0.5 pts on FX and 0.3 pts on indices.
Economic calendar
Web Trader platform
Our sophisticated web-based platform is packed with features.
Related articles
AUD/USD Q4 Outlook: RBA and Fed Hikes Set the Tone
AUD/USD enters Q4 with RBA and Fed hikes in focus as sticky inflation, rising unemployment and US dollar strength shape the Australian dollar.
USD/JPY Q4 2026 Outlook: Hawkish Fed Pricing Clashes With Intervention Risk
The year-end tug-of-war is clear: hawkish Fed pricing supports USD/JPY, while intervention risk limits the upside.
Japanese Yen Forecast: USD/JPY 4% Rally Challenges Post-Intervention Downtrend 9 24 2026
USD/JPY momentum has shifted sharply higher, putting a major resistance confluence in focus as U.S. and Japanese event risk builds.

This report is intended for general circulation only. It should not be construed as a recommendation, or an offer (or solicitation of an offer) to buy or sell any financial products. The information provided does not take into account your specific investment objectives, financial situation or particular needs. Before you act on any recommendation that may be contained in this report, independent advice ought to be sought from a financial adviser regarding the suitability of the investment product, taking into account your specific investment objectives, financial situation or particular needs.
StoneX Financial Pte. Ltd., may distribute reports produced by its respective foreign entities or affiliates within the StoneX group of companies or third parties pursuant to an arrangement under Regulation 32C of the Financial Advisers Regulations. Where the report is distributed to a person in Singapore who is not an accredited investor, expert investor or an institutional investor (as defined in the Securities Futures Act), StoneX Financial Pte. Ltd. accepts legal responsibility to such persons for the contents of the report only to the extent required by law. Singapore recipients should contact StoneX Financial Pte. Ltd. at 6826 9988 for matters arising from, or in connection with the report.
In the case of all other recipients of this report, to the extent permitted by applicable laws and regulations neither StoneX Financial Pte. Ltd. nor its associated companies will be responsible or liable for any loss or damage incurred arising out of, or in connection with, any use of the information contained in this report and all such liability is hereby expressly disclaimed. No representation or warranty is made, express or implied, that the content of this report is complete or accurate.
StoneX Financial Pte. Ltd. is not under any obligation to update this report.
Trading CFDs carries a high level of risk that may not be suitable for some investors. Consider your investment objectives, level of experience, financial resources, risk appetite and other relevant circumstances carefully. The possibility exists that you could lose some or all of your investments, including your initial deposits. If in doubt, please seek independent expert advice. Visit www.forex.com/en-sg/terms-and-policies for the complete Risk Disclosure Statement.