





USD/JPY: Testing 200DMA as traders ready for inflation fireworks
USD/JPY is testing its 200DMA, with traders eyeing today’s US inflation report as a potential catalyst. A strong core print could ignite bond yields and push the pair higher, while a softer outcome might cool the rally and invite fresh selling pressure. Tail risks look particularly acute around this important event.
Share this:

- USD/JPY hovers at the 200DMA after a bullish breakout
- US inflation to guide yields and FX moves
- Strong core CPI could lift yields, boosting USD/JPY
- A miss may cap gains, inviting fresh selling pressure
Overview
USD/JPY is doing battle with the 200-day moving average on the daily charts, bolstered by a technical breakout and reversal higher in US bond yields. With US 10-year Treasury futures warning of a potential bearish reversal ahead of the US inflation report due later Wednesday, leading to higher US yields, a break above this key moving average could see a quick return to highs struck around the US presidential election.
US bond yields still driving USD/JPY
Source: TradingView
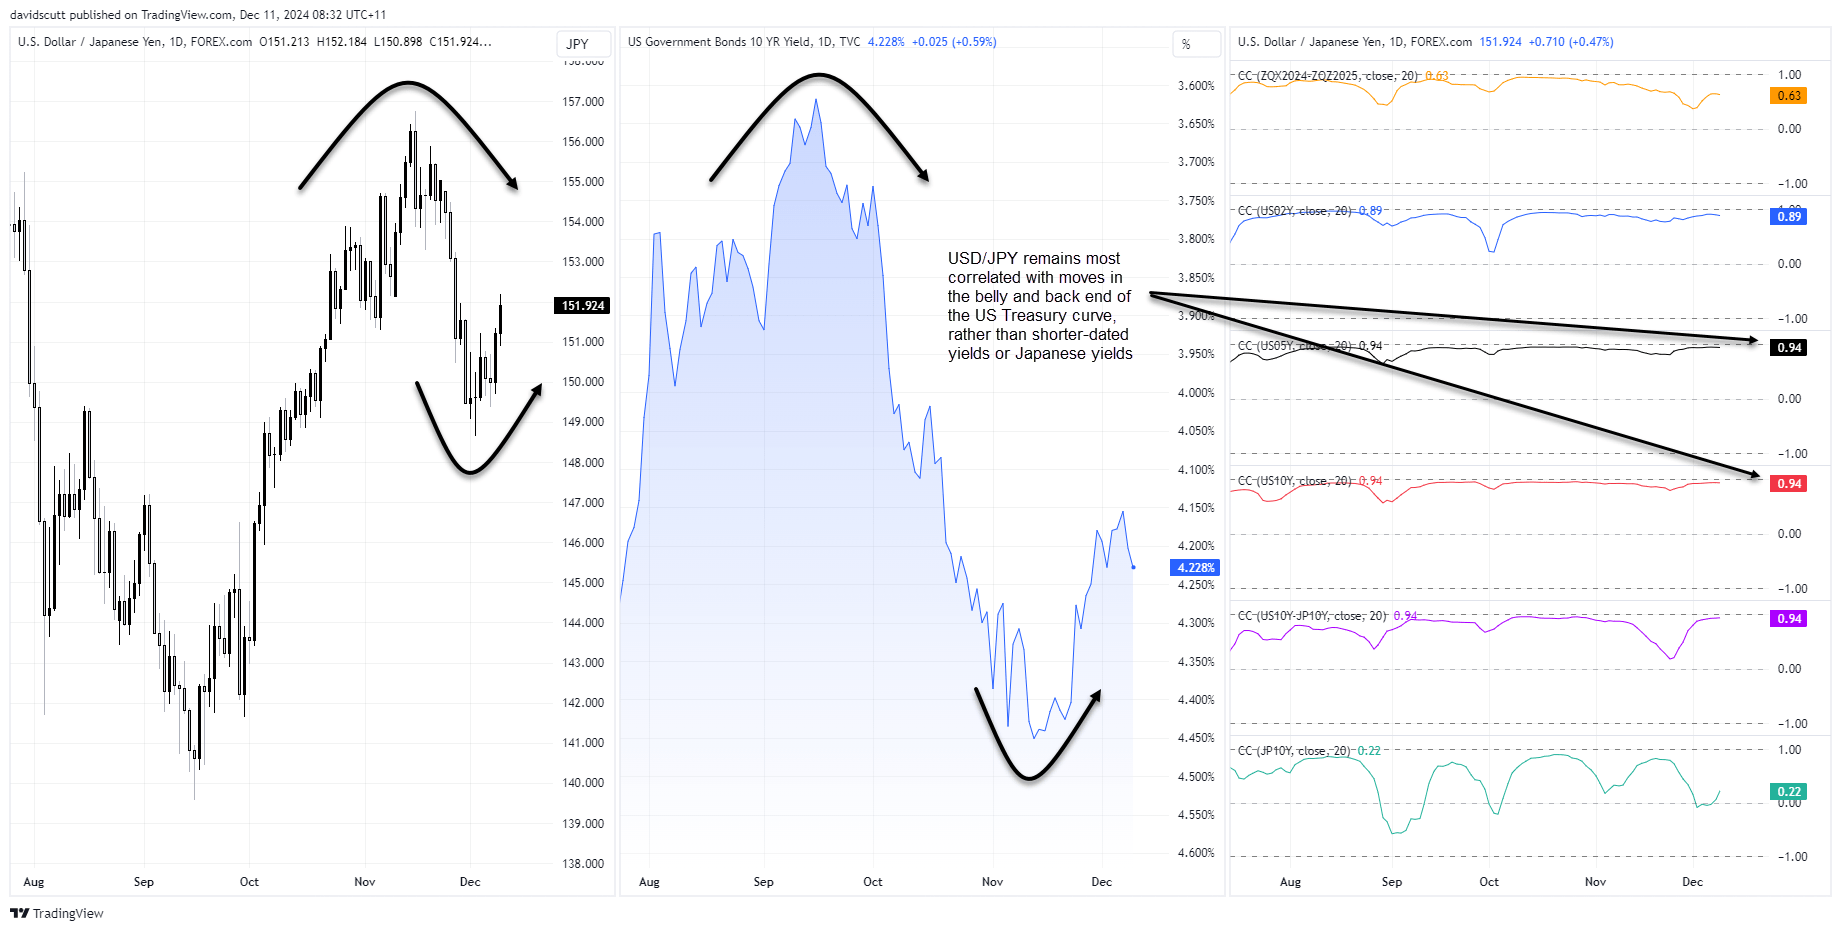
USD/JPY remains tied at the hip to movements Treasury yields in the belly and back end of the US curve, with rolling correlations with five and 10-year yields of 0.94 apiece over the past month. It remains a US growth and inflation-linked play, a point reinforced by the insignificant relationship with Japanese 10-year yields over the same period.
US Treasury futures warn of higher yields
Of course, it’s difficult to predict which direction US Treasury yields are likely to move before key economic data, but benchmark note futures can give you a sense as to how bond traders are thinking.
Source: TradingView
After a sustained break higher in late November, the rally in futures stalled earlier this week, seeing the price threaten to break back below the key 50-day moving average. Momentum indicators such as RSI (14) and MACD are looking heavy, and while Monday’s candle was not quite a bearish engulfing, you get the sense we may need to see a decent undershot on the core US inflation print later Wednesday to prevent a retest of the uptrend established on November 15.
As the price of futures moves inversely to yields, such a scenario would generate upside risks for USD/JPY given the strong correlation between the two variables.
US inflation report a key risks event
The key number to watch in the inflation report is the core reading, which strips out energy and food prices. It’s expected to print 0.3% in November, an outcome that would be the fourth identical print in a row. Whether you’re talking one or three-month timeframes, monthly prints of that magnitude annualise to 3.6%, near-double the Fed’s 2% target.
Source: TradingView
If we were to see a print in line or above expectation, especially if not dominated by shelter prices, it could easily see markets pare expectations for four Fed rate cuts by the end of next year substantially, pushing yields higher further out the US interest rate curve.
An undershoot in the core measure would deliver the opposite outcome, of course.
USD/JPY tests 200DMA following bullish break
Source: TradingView
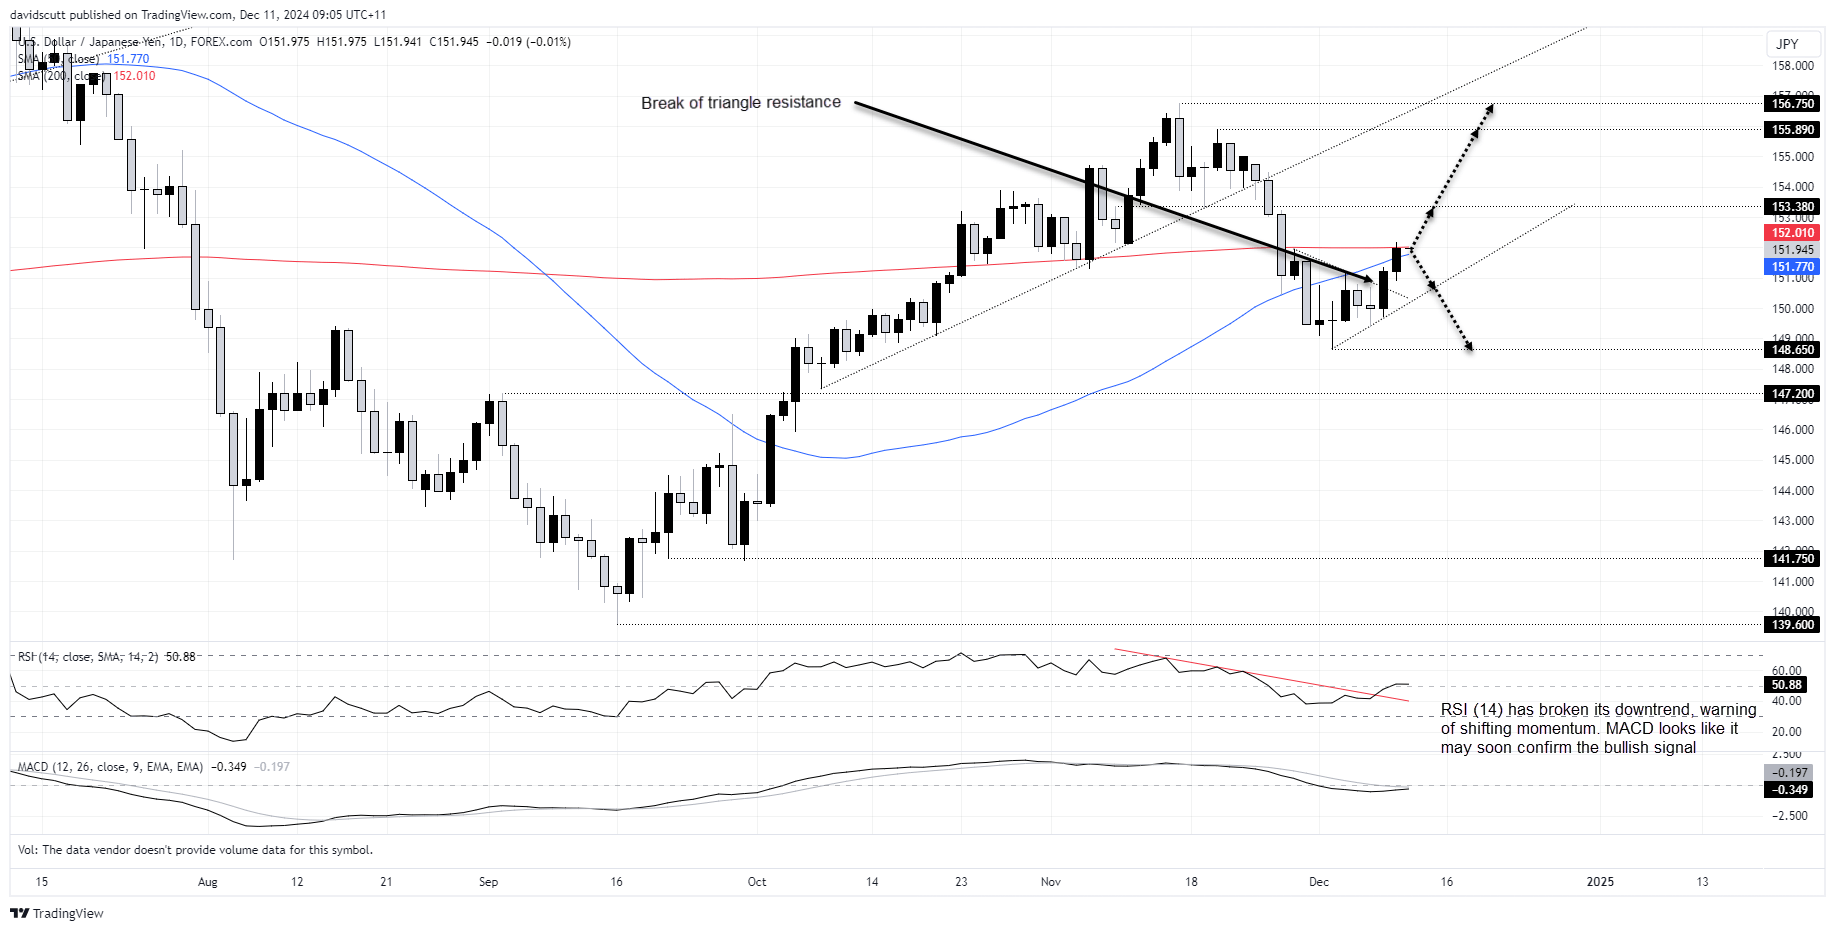
Looking at the USD/JPY daily chart, both price and momentum risks appear to be turning higher. The former broke out of the symmetrical triangle pattern it had been trading in with gusto earlier this week, extending the move before eventually stalling at the 200-day moving average.
A sustained break above the 200DMA would bring a retest of 153.38 into play, a level that acted as both support and resistance during November. Above, there’s not a lot to speak of until 155.89 and 156.75.
Traders could use the 200DMA to build trade setups around, allowing for a stop to be placed on the opposite side to entry depending on how the price interacts with the level.
If the price were unable to break the 200DMA, shorts could be initiated beneath with a stop above for protection. Potential targets include former triangle support located around 150.25 today or even 148.65.
-- Written by David Scutt
Follow David on Twitter @scutty
How to trade with City Index
You can trade with City Index by following these four easy steps:
- Open an account, or log in if you’re already a customer
• Open an account in the UK
• Open an account in Australia
• Open an account in Singapore
- Search for the market you want to trade in our award-winning platform
- Choose your position and size, and your stop and limit levels
- Place the trade
Related tags:
Latest market news




Open an account in minutes
Experience award-winning platforms with fast and secure execution, and enjoy tight spreads from 0.5 pts on FX and 0.3 pts on indices.
Economic calendar
Web Trader platform
Our sophisticated web-based platform is packed with features.
Related articles
AUD/USD Q4 Outlook: RBA and Fed Hikes Set the Tone
AUD/USD enters Q4 with RBA and Fed hikes in focus as sticky inflation, rising unemployment and US dollar strength shape the Australian dollar.
USD/JPY Q4 2026 Outlook: Hawkish Fed Pricing Clashes With Intervention Risk
The year-end tug-of-war is clear: hawkish Fed pricing supports USD/JPY, while intervention risk limits the upside.
Japanese Yen Forecast: USD/JPY 4% Rally Challenges Post-Intervention Downtrend 9 24 2026
USD/JPY momentum has shifted sharply higher, putting a major resistance confluence in focus as U.S. and Japanese event risk builds.

This report is intended for general circulation only. It should not be construed as a recommendation, or an offer (or solicitation of an offer) to buy or sell any financial products. The information provided does not take into account your specific investment objectives, financial situation or particular needs. Before you act on any recommendation that may be contained in this report, independent advice ought to be sought from a financial adviser regarding the suitability of the investment product, taking into account your specific investment objectives, financial situation or particular needs.
StoneX Financial Pte. Ltd., may distribute reports produced by its respective foreign entities or affiliates within the StoneX group of companies or third parties pursuant to an arrangement under Regulation 32C of the Financial Advisers Regulations. Where the report is distributed to a person in Singapore who is not an accredited investor, expert investor or an institutional investor (as defined in the Securities Futures Act), StoneX Financial Pte. Ltd. accepts legal responsibility to such persons for the contents of the report only to the extent required by law. Singapore recipients should contact StoneX Financial Pte. Ltd. at 6826 9988 for matters arising from, or in connection with the report.
In the case of all other recipients of this report, to the extent permitted by applicable laws and regulations neither StoneX Financial Pte. Ltd. nor its associated companies will be responsible or liable for any loss or damage incurred arising out of, or in connection with, any use of the information contained in this report and all such liability is hereby expressly disclaimed. No representation or warranty is made, express or implied, that the content of this report is complete or accurate.
StoneX Financial Pte. Ltd. is not under any obligation to update this report.
Trading CFDs carries a high level of risk that may not be suitable for some investors. Consider your investment objectives, level of experience, financial resources, risk appetite and other relevant circumstances carefully. The possibility exists that you could lose some or all of your investments, including your initial deposits. If in doubt, please seek independent expert advice. Visit www.forex.com/en-sg/terms-and-policies for the complete Risk Disclosure Statement.